
Figures & data
Table 1. Baseline clinicopathological features of the 36 enrolled patients.
Figure 1. Effects of abatacept on RA. (A) Effects of abatacept treatment on SDAI in 36 patients. Data deficit was compensated by the LOCF method. *p < 0.05 versus 0 week (baseline), Wilcoxon signed-rank test. ABT, abatacept. (B) Effects of abatacept treatment on SDAI in 7 bio-switch patients and 29 bio-naïve patients. Data deficit compensated by the LOCF method. *p < 0.05 versus 0 week (baseline), Wilcoxon signed-rank test. The difference between two groups was examined by Mann–Whitney U test. ABT, abatacept, NS, not significant. (C) Effects of abatacept and MTX combination treatment on SDAI in 27 patients and of abatacept alone in 9 patients. Data deficit was compensated by the LOCF method. *p < 0.05 versus 0 week (baseline), Wilcoxon signed-rank test. The difference between two groups was examined by Mann–Whitney U test. ABT, abatacept, NS, not significant.
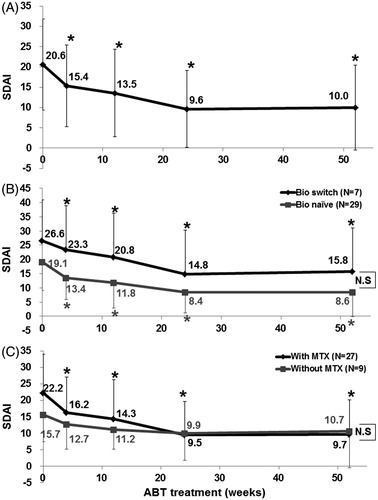
Figure 2. Effects of abatacept treatment on RA disease activity. (A) Effects of abatacept treatment on disease activity as assessed by SADI in 36 patients over the 52-week period. Data deficit was compensated by the LOCF method. (B) Effects of abatacept treatment on disease activity as assessed by SDAI in 7 bio-switch patients and 29 bio-naïve patients. Data deficit was compensated by the LOCF method. Difference between two groups was examined by Cochran-Armitage Test. There was no significant difference between the groups. (C) Effects of abatacept and MTX combination treatment on disease activity as assessed by SDAI in 27 patients and of abatacept alone in 9 patients. Data deficit was compensated by the LOCF method. Difference between two groups was examined by Cochran-Armitage Test. There was no significant difference.
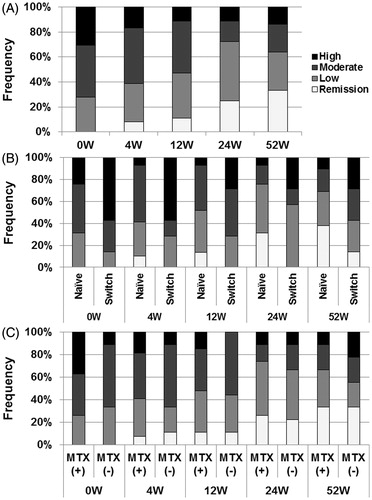
Figure 3. Effects of abatacept on VAS in SS. (A) Effects of abatacept treatment on patients’ VAS for dry mouth, dry eye, and parotid pain in 33 patients. Data deficit was compensated by the LOCF method. *p < 0.05 versus 0 week (baseline), Wilcoxon signed-rank test. VAS, visual analog scale, NS, not significant. (B) Effects of abatacept treatment on physicians’ VAS for dry mouth, KCS, and general condition in 32 patients. Data deficit was compensated by the LOCF method. *p < 0.05 versus 0 week (baseline), Wilcoxon signed-rank test. VAS, visual analog scale; KCS, keratoconjunctivitis sicca.
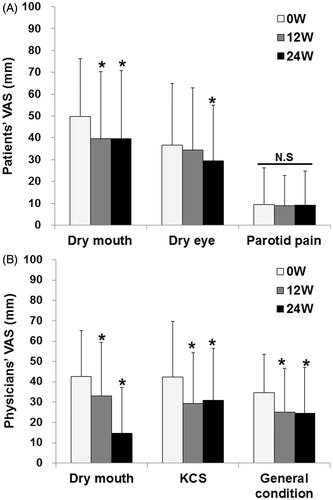
Figure 4. Effects of abatacept on secretory function in SS. (A) Effects of abatacept treatment on saliva volume assessed by Saxon’s test in 34 patients. Data deficit was compensated by the LOCF method. *p < 0.05 versus 0 week (baseline), Wilcoxon signed-rank test. ABT, abatacept. (B) Effect of abatacept treatment on saliva volume assessed by Saxon’s test in 11 patients with Greenspan grading 1 or 2 of LSG biopsy and in 18 patients with grade 3 or 4. Data deficit was compensated by the LOCF method. *p < 0.05 versus 0 week (baseline), Wilcoxon signed-rank test. The difference between the two groups was examined by Mann–Whitney U test. ABT, abatacept; NS, not significant. (C) Effects of abatacept treatment on tear volume assessed by Schirmer’s test in 30 patients. Data deficit was compensated by the LOCF method. *p < 0.05 versus 0 week (baseline), Wilcoxon signed-rank test. ABT, abatacept.
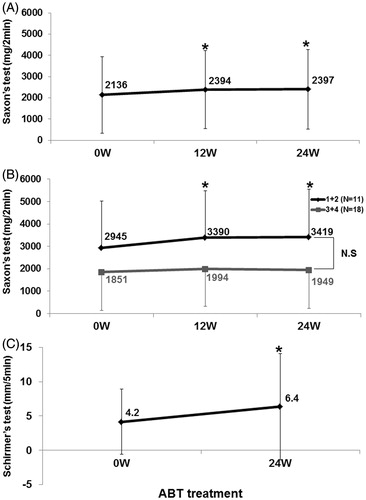
Table 2. Changes in parotid MRI and correlation with Greenspan grading of LSD biopsy and salivary secretion.
Figure 5. Effects of abatacept on IgG, RF, and anti-SS-A antibody. Effects of abatacept treatment on (A) serum IgG level (n = 36), (B) serum RF level (n = 35). (C) Titer of anti-SS-A antibody (n = 22). Data deficit was compensated by the LOCF method. *p < 0.05 versus 0 week (baseline); NS, not significant versus baseline, Wilcoxon signed-rank test. ABT, abatacept.
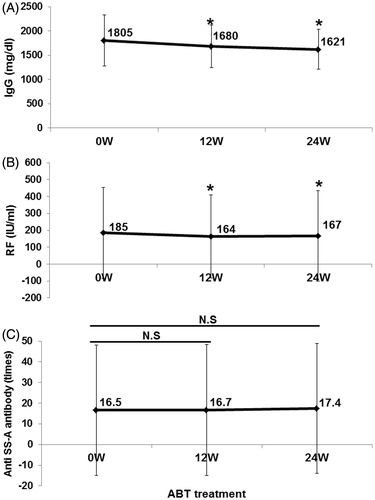
Figure 6. Correlation between improvement of SS and RA manifestations. Correlation between (A) increase in saliva volume (assessed by Saxon’s test) and improvement in SDAI (n = 34) from baseline to 24 weeks. Spearman's rank correlation coefficient = 0.300, p = 0.085, and (B) between increase in tear volume (assessed by Schirmer’s test) and improvement in SDAI (n = 30) from baseline to 24 weeks. Spearman's rank correlation coefficient = 0.287, p = 0.124. Correlation between (C) the ratio of increase in saliva volume to baseline value (the increase in saliva volume from baseline to 24 weeks/saliva volume at baseline) and the ratio of improvement in SDAI to baseline value (the improvement in SDAI from baseline to 24 weeks/SDAI at baseline) (n = 34). Spearman's rank correlation coefficient = 0.347, p = 0.044, and (D) between the ratio of increase in tear volume to baseline value (the increase in tear volume from baseline to 24 weeks/tear volume at baseline) and the ratio of improvement in SDAI to baseline value (n = 27). Spearman's rank correlation coefficient = 0.220, p = 0.270. Data deficit was compensated by the LOCF method.
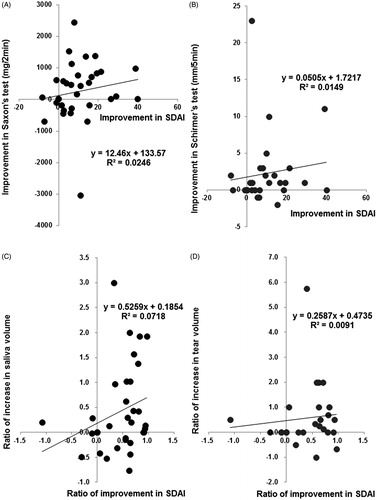
Figure 7. Adherence to abatacept. The adherence rate to abatacept analyzed by Kaplan–Meier method was 80.6% (29/36) for 52 week.
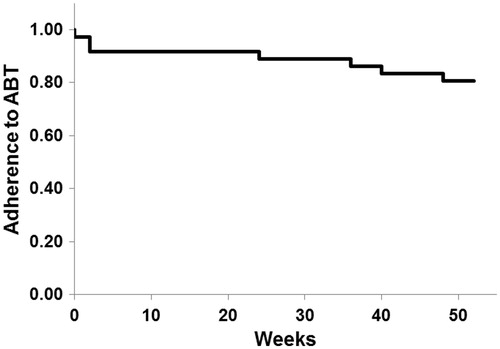
Table 3. Adverse events in 36 cases during 52 weeks.