Figures & data
Figure 1. (a) Kaplan–Meier estimate of the probability of continuing treatment with TCZ. The upper black line indicates the continuation rate when the reason for discontinuation was limited to inadequate response (IR) or adverse events (AEs). The lower gray line indicates the total continuation rate. (b) Changes in DAS28-ESR in all patients. Mean values are shown. Bars indicate standard deviation (SD). (c) Disease activity over time. The categories are based on the DAS28-ESR (<2.6: remission, ≥2.6 and <3.2: low disease activity, 3.2–5.1: moderate disease activity, and <5.1: high disease activity). (d) Percentage of patients achieving each component of the Boolean-based remission criteria or achieving remission at 0, 6, 12, 24, and 36 months.
![Figure 1. (a) Kaplan–Meier estimate of the probability of continuing treatment with TCZ. The upper black line indicates the continuation rate when the reason for discontinuation was limited to inadequate response (IR) or adverse events (AEs). The lower gray line indicates the total continuation rate. (b) Changes in DAS28-ESR in all patients. Mean values are shown. Bars indicate standard deviation (SD). (c) Disease activity over time. The categories are based on the DAS28-ESR (<2.6: remission, ≥2.6 and <3.2: low disease activity, 3.2–5.1: moderate disease activity, and <5.1: high disease activity). (d) Percentage of patients achieving each component of the Boolean-based remission criteria or achieving remission at 0, 6, 12, 24, and 36 months.](/cms/asset/e4e3395e-74b3-4831-beaf-7f735573530c/imor_a_1160991_f0001_b.jpg)
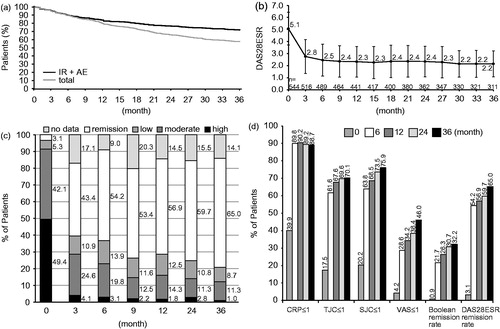
Table 1. Baseline characteristics of the patients.
Figure 2. (a) Changes in DAS28-ESR according to the history of TNFi use. Mean values are shown. Bars indicate SD. (b) Changes in DAS28-ESR according to disease activity at baseline. (c) Changes in DAS28-ESR according to age. (d) Change in DAS28-ESR according to comorbidities.
![Figure 2. (a) Changes in DAS28-ESR according to the history of TNFi use. Mean values are shown. Bars indicate SD. (b) Changes in DAS28-ESR according to disease activity at baseline. (c) Changes in DAS28-ESR according to age. (d) Change in DAS28-ESR according to comorbidities.](/cms/asset/d61381cb-87f7-4a37-b60c-2cb6fa81b4d4/imor_a_1160991_f0002_b.jpg)
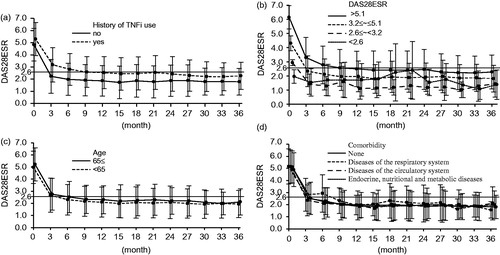
Table 2. Factors influencing Boolean remission.
Figure 3. (a) Annual radiographic progression over 3 years. Data from plain radiography were compared between baseline and 1 year in 48 patients, between 1 year and 2 years in 42 patients, and between 2 years and 3 years in 44 patients to calculate the ΔmTSS/year. (b) Cumulative probability plot of annual changes in mTSS from baseline to 1 year, from 2 to 2 years, and from 2 to 3 years. (c) Cumulative probability plot of changes in mTSS from baseline to 3 years. Data from plain radiography were compared between baseline and 3 years in 50 patients to calculate the ΔmTSS/3 years.
![Figure 3. (a) Annual radiographic progression over 3 years. Data from plain radiography were compared between baseline and 1 year in 48 patients, between 1 year and 2 years in 42 patients, and between 2 years and 3 years in 44 patients to calculate the ΔmTSS/year. (b) Cumulative probability plot of annual changes in mTSS from baseline to 1 year, from 2 to 2 years, and from 2 to 3 years. (c) Cumulative probability plot of changes in mTSS from baseline to 3 years. Data from plain radiography were compared between baseline and 3 years in 50 patients to calculate the ΔmTSS/3 years.](/cms/asset/099cb3c4-8151-4ba4-9402-51b8fd399840/imor_a_1160991_f0003_b.jpg)
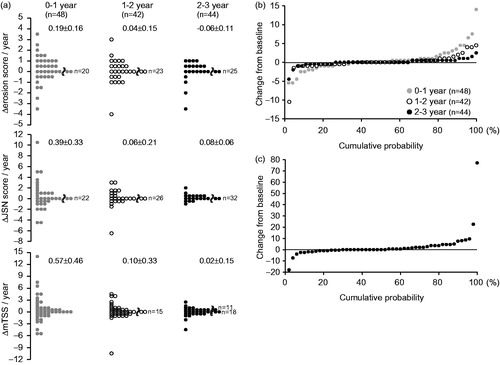
Table 3. Predictor of structural remission during 3 years.