Figures & data
Figure 1. Chemical structures of L-carnitine (a), mildronate (3-(2,2,2-trimethylhydrazinium) propionate) (b), and γ-butyrobetaine (GBB) (c).

Figure 2. Lineweaver–Burk (A) and Michaelis–Menten (B) kinetic plots for carnitine as the variable substrate at a range of two fixed mildronate concentrations. Points represent mean ± SEM (n = 3).
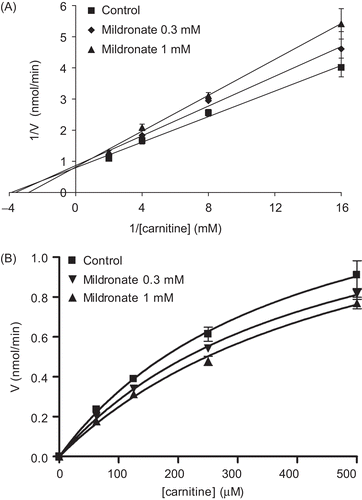
Figure 3. Dose–response curves for the inhibition of carnitine acetyltransferase (CrAT) by mildronate at carnitine concentrations 0.0625, 0.25, 0.5, and 1 mM. Points represent mean ± SEM (n = 3).
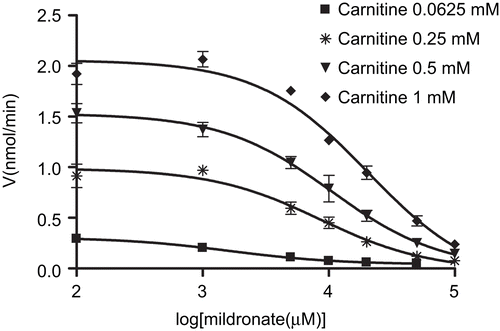
Figure 4. Henderson plot analysis of the mode of interaction of mildronate with CrAT. Points represent mean ± SEM (n = 3). It, total concentration of inhibitor; V0, control velocity; Vi, velocity in presence of inhibitor.
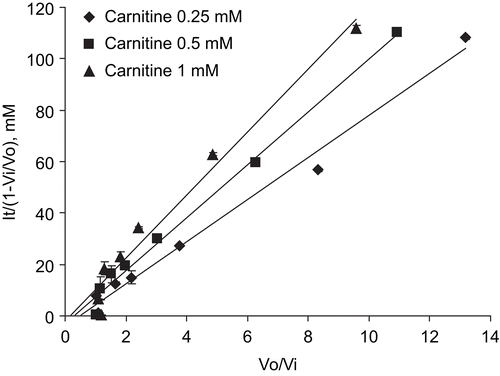
Figure 5. The linewidth of trimethylammonium group (lower), α-methylene group (middle), and β-methylene group (upper) proton signals of mildronate as a function of [mildronate] (mM) at constant [CrAT] = 20 μM. The circles, squares, and triangles are the experimental points, and the curves are the fitted binding isotherms. The estimated KD values are 119 μM (νfree = 1.47 Hz, νbound = 3.85 Hz), 74 μM (νfree = 1.47 Hz, νbound = 4.73 Hz), and 110 μM (νfree = 1.78 Hz, νbound = 5.47 Hz) for trimethylammonium, α-methylene, and β-methylene group signals respectively. The calculated KD for mildronate is 101 ± 19 μM.
![Figure 5. The linewidth of trimethylammonium group (lower), α-methylene group (middle), and β-methylene group (upper) proton signals of mildronate as a function of [mildronate] (mM) at constant [CrAT] = 20 μM. The circles, squares, and triangles are the experimental points, and the curves are the fitted binding isotherms. The estimated KD values are 119 μM (νfree = 1.47 Hz, νbound = 3.85 Hz), 74 μM (νfree = 1.47 Hz, νbound = 4.73 Hz), and 110 μM (νfree = 1.78 Hz, νbound = 5.47 Hz) for trimethylammonium, α-methylene, and β-methylene group signals respectively. The calculated KD for mildronate is 101 ± 19 μM.](/cms/asset/1950b4a2-cb52-4f3c-bb12-d6e45a34860c/ienz_a_383122_f0005_b.gif)
Figure 6. The γ- methylene proton saturation transfer difference (STD) signal of carnitine at 3.265 ppm was reduced by titration of mildronate to a sample of carnitine (0.18 mM) and CrAT (binding site concentration 15 μM). The STD signal of the trimethylammonium group at 3.185 ppm increased with increasing concentration of mildronate. The lines (——–), (– · – · –), (– – – –), and (· · · · · ·) correspond to carnitine/mildronate ratios of 1:0, 1:1, 1:2, and 1:3.
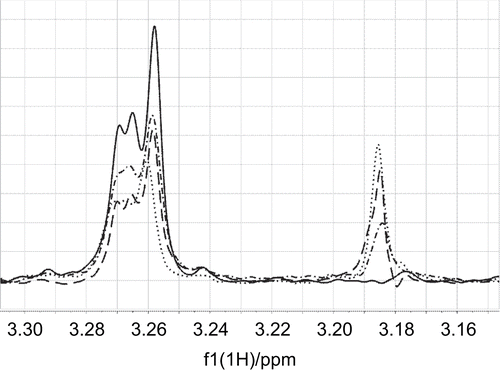
Figure 7. The intensity of an STD signal of acetyl-CoA at 2.165 ppm did not change upon addition of the non-competing ligand mildronate to a mixture of acetyl-CoA (0.18 mM) and CrAT (15 μM). The STD signal of α-methylene protons at 2.22 ppm increased with increasing concentration of mildronate. The lines (·······), (– – – –), and (——–) correspond to acetyl-CoA/mildronate ratios of 1:0, 1:10, and 1:20.
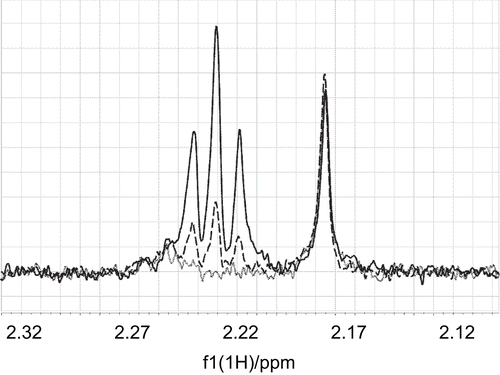
Figure 8. a) 1D 1H NMR spectrum of carnitine; b) 1D STD spectrum of carnitine; c) 1D 1H spectrum of mildronate; d) 1D STD spectrum of mildronate.
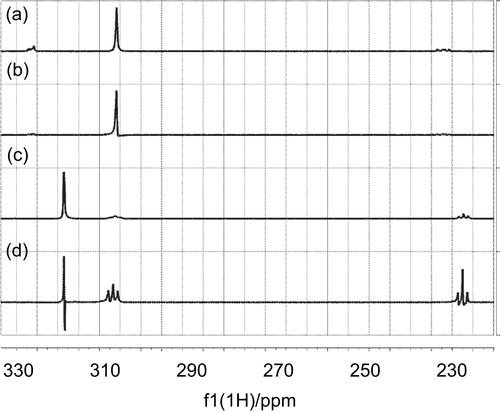
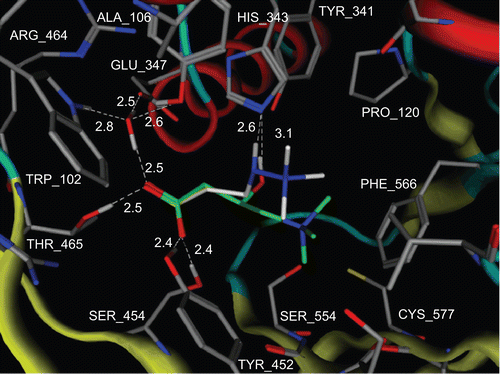
Figure 9. Proposed model for the positioning of carnitine and mildronate in CrAT enzyme. Carnitine carbons are shown in green and mildronate carbons are shown in white. All hydrogens, except those involved in hydrogen bonds, are omitted. Protein backbone is shown as tubes. Hydrogen bonds are shown as white dashed lines. White labels correspond to amino acid residues and distances between heavy atoms, which are involved in hydrogen bonding. Produced with MOE 2007.09.
