1,491
Views
22
CrossRef citations to date
0
Altmetric
Research Article

Oxidative modification of citrate synthase by peroxyl radicals and protection with novel antioxidants

, , , &
Pages 1319-1331 | Received 21 Jan 2009, Accepted 23 Feb 2009, Published online: 01 Oct 2009

Figures & data

Figure 1. The effect of 2,2′-azobis(2-amidinopropane) dihydrochloride (AAPH) on the enzymatic activity of mitochondrial citrate synthase (CS) and aconitase. Whole mitochondria were isolated from PC-12AC cells, treated with 30 mM glucose, 40 mM AAPH, or a combination of both for 8 and 24 h at 37°C and assayed for CS and aconitase activities. Ten or 100 μL of the incubation mixture was removed for the assay of CS (A) or aconitase (B) activities, respectively. Means of three independent experiments ± SEM are shown. *Significantly different from untreated controls at p < 0.001 as tested with one-way ANOVA followed by Tukey test.
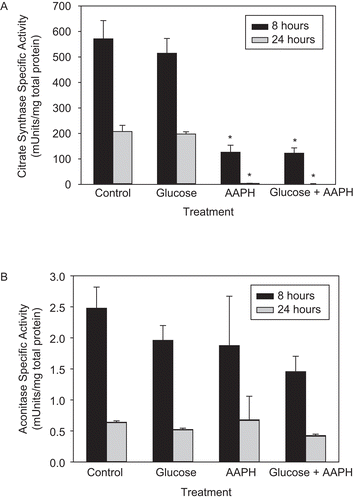
Figure 1.  The effect of 2,2′-azobis(2-amidinopropane) dihydrochloride (AAPH) on the enzymatic activity of mitochondrial citrate synthase (CS) and aconitase. Whole mitochondria were isolated from PC-12AC cells, treated with 30 mM glucose, 40 mM AAPH, or a combination of both for 8 and 24 h at 37°C and assayed for CS and aconitase activities. Ten or 100 μL of the incubation mixture was removed for the assay of CS (A) or aconitase (B) activities, respectively. Means of three independent experiments ± SEM are shown. *Significantly different from untreated controls at p < 0.001 as tested with one-way ANOVA followed by Tukey test.

Figure 2. (A) CS inactivation by AAPH. CS (6 μM) was incubated with various concentrations of AAPH. Sample aliquots were taken at the time intervals indicated, the reaction was stopped by excessive dilution in 0.1 M Tris-HCl, pH 7.0, and the remaining enzymatic activity was measured immediately, as described in “Materials and methods.” Means of at least three independent experiments ± SEM are shown. (B) CS aggregates as a result of AAPH treatment. CS (12 μM) was incubated with 40 mM AAPH, and aliquots were removed at various time intervals as shown, frozen immediately and stored at −80°C until use. For sodium dodecyl sulfate-polyacrylamide gel electrophoresis (SDS-PAGE), 14 μg of total protein was loaded per lane and the electrophoresis was run followed by Coomassie staining, as described in “Materials and methods.” Representative gel of three independent experiments is shown. C is control and T is AAPH-treated sample. M and A denote the CS monomer and aggregates, respectively.
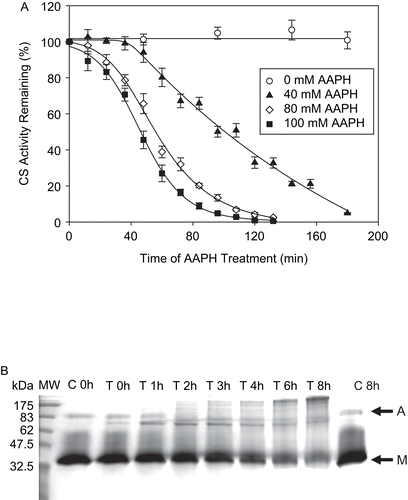
Figure 2.  (A) CS inactivation by AAPH. CS (6 μM) was incubated with various concentrations of AAPH. Sample aliquots were taken at the time intervals indicated, the reaction was stopped by excessive dilution in 0.1 M Tris-HCl, pH 7.0, and the remaining enzymatic activity was measured immediately, as described in “Materials and methods.” Means of at least three independent experiments ± SEM are shown. (B) CS aggregates as a result of AAPH treatment. CS (12 μM) was incubated with 40 mM AAPH, and aliquots were removed at various time intervals as shown, frozen immediately and stored at −80°C until use. For sodium dodecyl sulfate-polyacrylamide gel electrophoresis (SDS-PAGE), 14 μg of total protein was loaded per lane and the electrophoresis was run followed by Coomassie staining, as described in “Materials and methods.” Representative gel of three independent experiments is shown. C is control and T is AAPH-treated sample. M and A denote the CS monomer and aggregates, respectively.

Table 1. The susceptibility of different enzymes to 2,2′-azobis (2-amidinopropane) dihydrochloride (AAPH)-mediated inactivation.

Figure 3. AAPH-induced increase in CS surface hydrophobicity. CS (6 μM) was incubated with 40 mM AAPH, aliquots were removed at several time points, diluted, and 1 μM CS was incubated with 100 μM 8-anilino-1-naphthalenesulfonic acid (ANSA) for 40 min at 37°C. The emission intensity was measured upon excitation at 325 nm, as described in “Materials and methods.” (A) Hydrophobicity spectra of AAPH-treated CS over time. (B) Increase in the emission intensity at 490 nm, characteristic for ANSA binding to protein surface hydrophobic residues. Means of at least three independent experiments ± SEM are shown.
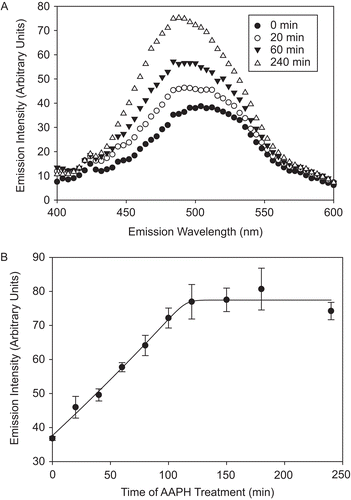
Figure 3.  AAPH-induced increase in CS surface hydrophobicity. CS (6 μM) was incubated with 40 mM AAPH, aliquots were removed at several time points, diluted, and 1 μM CS was incubated with 100 μM 8-anilino-1-naphthalenesulfonic acid (ANSA) for 40 min at 37°C. The emission intensity was measured upon excitation at 325 nm, as described in “Materials and methods.” (A) Hydrophobicity spectra of AAPH-treated CS over time. (B) Increase in the emission intensity at 490 nm, characteristic for ANSA binding to protein surface hydrophobic residues. Means of at least three independent experiments ± SEM are shown.

Figure 4. Kinetics of tryptophan (Trp) fluorescence loss of CS as a result of AAPH treatment. CS (6 μM) was incubated with 40 mM AAPH, aliquots were removed at several time points, diluted, and the fluorescent emission intensity was measured at 300–400 nm upon excitation at 295 nm, as described in “Materials and methods.” (A) Trp fluorescence spectra of AAPH-treated CS over time. (B) Decrease in the emission intensity at 330 nm. Means of three independent experiments ± SEM are shown.
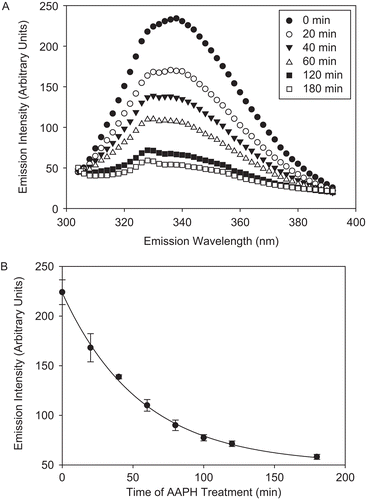
Figure 4.  Kinetics of tryptophan (Trp) fluorescence loss of CS as a result of AAPH treatment. CS (6 μM) was incubated with 40 mM AAPH, aliquots were removed at several time points, diluted, and the fluorescent emission intensity was measured at 300–400 nm upon excitation at 295 nm, as described in “Materials and methods.” (A) Trp fluorescence spectra of AAPH-treated CS over time. (B) Decrease in the emission intensity at 330 nm. Means of three independent experiments ± SEM are shown.

Figure 5. CS exposure to AAPH leads to dityrosine (diTyr) formation. CS (12 μM) was incubated with 40 mM AAPH, and aliquots were removed and fluorescent emission intensity was measured using excitation wavelength of 325 nm, as described in “Materials and methods.” (A) diTyr spectra of AAPH-treated CS over time. (Inset) The emission intensity of 1 mM Tyr treated with 40 mM AAPH for 2 h at 37°C and excited at 325 nm. (B) Increase in emission intensity at 420 nm, indicative of diTyr formation. (Inset) The correlation between diTyr formation (as measured by emission intensity) and CS activity loss. Means of three independent experiments ± SEM are shown.
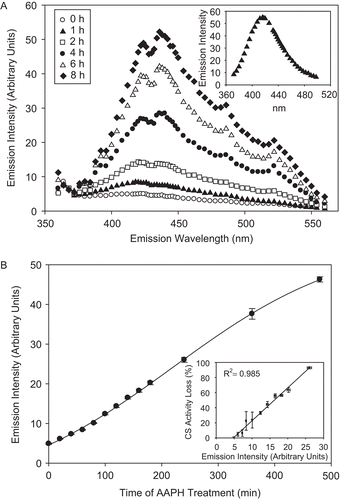
Figure 5.  CS exposure to AAPH leads to dityrosine (diTyr) formation. CS (12 μM) was incubated with 40 mM AAPH, and aliquots were removed and fluorescent emission intensity was measured using excitation wavelength of 325 nm, as described in “Materials and methods.” (A) diTyr spectra of AAPH-treated CS over time. (Inset) The emission intensity of 1 mM Tyr treated with 40 mM AAPH for 2 h at 37°C and excited at 325 nm. (B) Increase in emission intensity at 420 nm, indicative of diTyr formation. (Inset) The correlation between diTyr formation (as measured by emission intensity) and CS activity loss. Means of three independent experiments ± SEM are shown.

Figure 6. The disappearance of CS Tyr-containing peptides during AAPH treatment, as assessed by mass spectrometry. (A) Peptide LDWSHNRTNMLGYTDAQFRELMR in untreated (with m/z (amu) between 930 and 933 (+2)) and (B) its disappearance in AAPH-treated CS. (C) Peptide DYIWNTLNSGR in untreated (with m/z (amu) between 669 and 671 (+2)) and (D) its disappearance in AAPH-treated CS. Note that the peptide ALGVLAQLIWSR, with m/z (amu) between 663 and 665 (+2), remains unaffected by treatment. The peptides in (A) and (C) contain Tyrs 246 and 331, respectively.
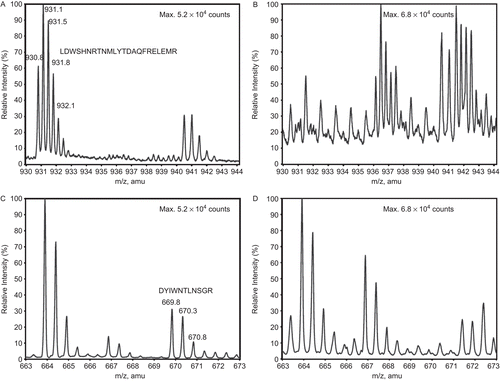
Figure 6.  The disappearance of CS Tyr-containing peptides during AAPH treatment, as assessed by mass spectrometry. (A) Peptide LDWSHNRTNMLGYTDAQFRELMR in untreated (with m/z (amu) between 930 and 933 (+2)) and (B) its disappearance in AAPH-treated CS. (C) Peptide DYIWNTLNSGR in untreated (with m/z (amu) between 669 and 671 (+2)) and (D) its disappearance in AAPH-treated CS. Note that the peptide ALGVLAQLIWSR, with m/z (amu) between 663 and 665 (+2), remains unaffected by treatment. The peptides in (A) and (C) contain Tyrs 246 and 331, respectively.

Figure 7. Structures of novel antioxidants (1,8-naphthalenediol (ND), 2,3-ND, and 1,4-ND) as well as propyl gallate (PG) and epigallocatechin gallate (EGCG) used to protect CS against inactivation by AAPH.
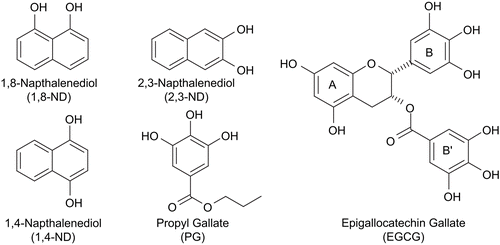
Figure 7.  Structures of novel antioxidants (1,8-naphthalenediol (ND), 2,3-ND, and 1,4-ND) as well as propyl gallate (PG) and epigallocatechin gallate (EGCG) used to protect CS against inactivation by AAPH.

Figure 8. Protection of CS against AAPH-induced inactivation. CS (6 μM) was incubated with the indicated concentrations of antioxidants prior to 40 mM AAPH treatment for 2 h. CS was then diluted and enzyme assays were performed as described in “Materials and methods.” Untreated CS controls (100% activity), AAPH-treated CS (0% activity), and percentage recovery with respect to AAPH-treated CS are shown. Means of at least three independent experiments ± SEM are presented. The IC50 was taken as the concentration of antioxidant capable of protecting CS against 50% loss of its enzymatic activity as a result of AAPH treatment.
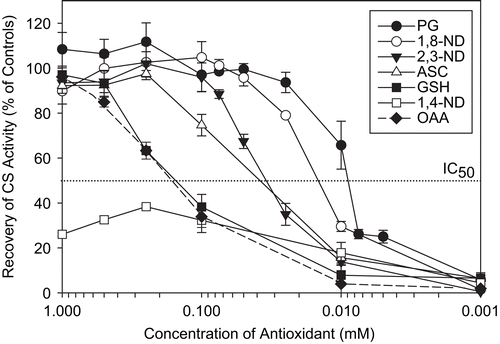
Figure 8.  Protection of CS against AAPH-induced inactivation. CS (6 μM) was incubated with the indicated concentrations of antioxidants prior to 40 mM AAPH treatment for 2 h. CS was then diluted and enzyme assays were performed as described in “Materials and methods.” Untreated CS controls (100% activity), AAPH-treated CS (0% activity), and percentage recovery with respect to AAPH-treated CS are shown. Means of at least three independent experiments ± SEM are presented. The IC50 was taken as the concentration of antioxidant capable of protecting CS against 50% loss of its enzymatic activity as a result of AAPH treatment.

Figure 9. EGCG-mediated inactivation of CS and protection against AAPH. (A) CS (6 μM) was incubated with the indicated concentrations of EGCG prior to 40 mM AAPH treatment for 2 h. CS was then diluted and enzyme assays were performed as described in “Materials and methods.” Untreated CS controls (100% activity) and the residual CS activity compared to controls are shown. Means of at least three independent experiments ± SEM are presented. *Significantly different from 40 mM AAPH-treated CS at p < 0.05 as tested with one-way ANOVA followed by Tukey test. **Significantly different from untreated CS controls at p < 0.001 as tested by Student’s t-test. (B) CS (6 μM) was incubated with indicated concentrations of EGCG for 30 min at 37°C, diluted, and the residual activity was measured. Mean values of at least three independent experiments ± SEM are shown.
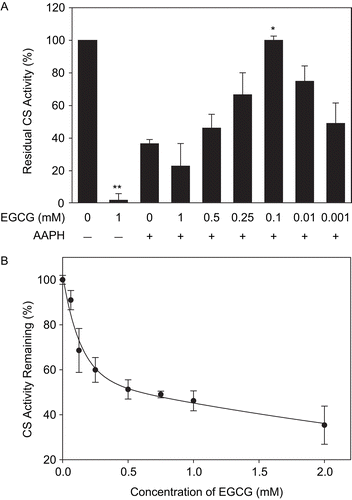
Figure 9.  EGCG-mediated inactivation of CS and protection against AAPH. (A) CS (6 μM) was incubated with the indicated concentrations of EGCG prior to 40 mM AAPH treatment for 2 h. CS was then diluted and enzyme assays were performed as described in “Materials and methods.” Untreated CS controls (100% activity) and the residual CS activity compared to controls are shown. Means of at least three independent experiments ± SEM are presented. *Significantly different from 40 mM AAPH-treated CS at p < 0.05 as tested with one-way ANOVA followed by Tukey test. **Significantly different from untreated CS controls at p < 0.001 as tested by Student’s t-test. (B) CS (6 μM) was incubated with indicated concentrations of EGCG for 30 min at 37°C, diluted, and the residual activity was measured. Mean values of at least three independent experiments ± SEM are shown.

Reprints and Corporate Permissions

Please note: Selecting permissions does not provide access to the full text of the article, please see our help page How do I view content?

To request a reprint or corporate permissions for this article, please click on the relevant link below:

Academic Permissions

Please note: Selecting permissions does not provide access to the full text of the article, please see our help page How do I view content?

Obtain permissions instantly via Rightslink by clicking on the button below:

If you are unable to obtain permissions via Rightslink, please complete and submit this Permissions form. For more information, please visit our Permissions help page.