Figures & data
Figure 1. Separation scheme of bioactive compounds from F. microcarpa.
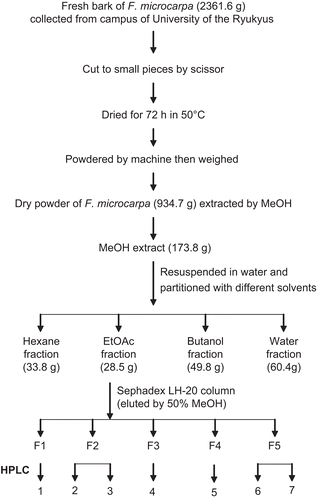
Figure 2. HPLC chromatograms as monitored by UV absorption at 280 nm for fractions F1–F5 in 50% methanol, as obtained by Sephadex LH-20 column chromatography of the ethyl acetate extract of F. microcarpa bark. The peaks numbered with Arabic numerals in the order of increasing retention time correspond to the compounds labeled with the numerals in .
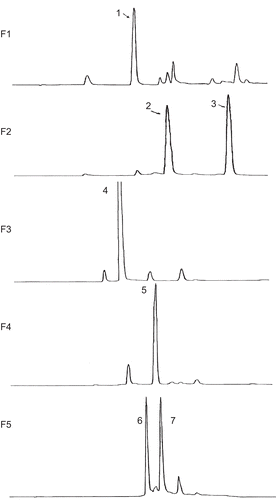
Figure 3. Chemical structures of isolated compounds from F. microcarpa.
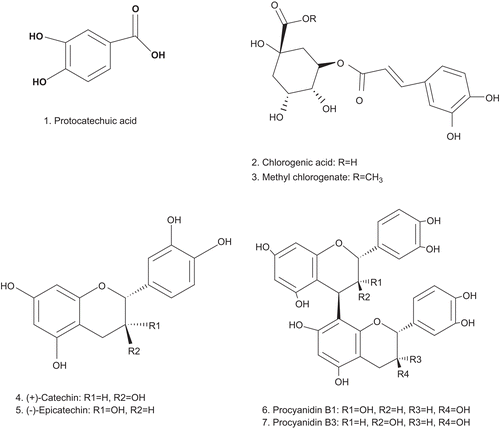
Figure 4. HPLC chromatograms as monitored by UV absorption at 280 nm (ODSpak column (150 mm × 4.60 mm; Shodex, Co.. Japan) for catechin, epicatechin, compounds 6, 7, and their hydrolyzates. (A) Standard of catechin and epicatechin (200 µg/mL); (B) compound 6; (C) hydrolyzate of 6; (D) compound 7; (E) hydrolyzate of 7. 1, catechin; 2, epicatechin.
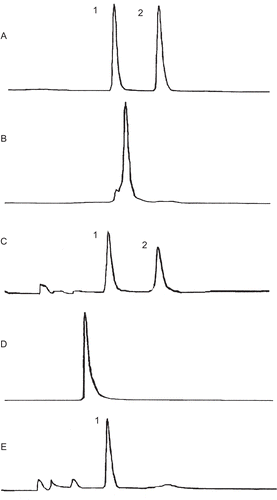
Figure 5. Hyaluronidase inhibitory activity by methanol extract and fractions of F. microcarpa. Each value is expressed as mean ± SD (n = 3), concentration of sample in assays is expressed as final concentration.
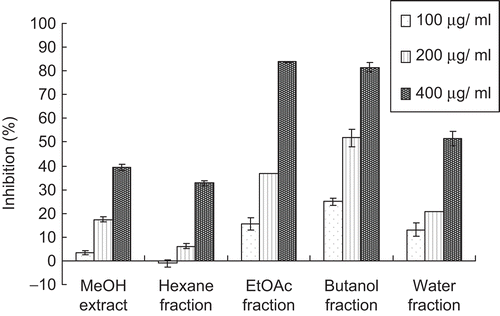
Figure 6. Hyaluronidase inhibitory activity by purified compounds of F. microcarpa. Each value is expressed as mean ± SD (n = 3), concentration of sample in assays is expressed as final concentration.
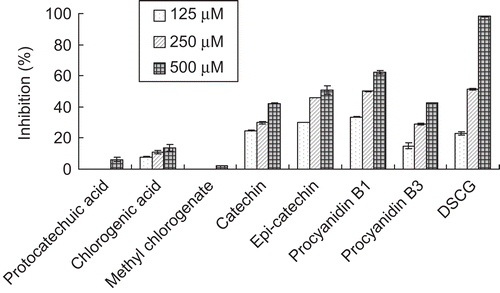
Table 1. Antioxidant activities of isolated compounds from F. microcarpa.
Table 2. Compound contents in F. microcarpa bark and ethyl acetate fraction.