Figures & data
Table 1. Chemical composition of L. alba EO characterized by GC/MS.
Table 2. MIC of L. alba linalool-rich EO against various dermatophyte strains by the microdilution method.
Figure 1. Effect of pH on the extracellular proteolytic activity of enzymes released from M. gypseum, E. floccosum and T. rubrum. Cells were grown in PDA medium for five days at room temperature. Subsequently, the culture supernatant was filtered, concentrated and tested for its ability to degrade soluble BSA at distinct pH values ranging from 1.0 to 11.0. The values represent the mean (± standard deviation) of three independent experiments, which were performed in triplicate.
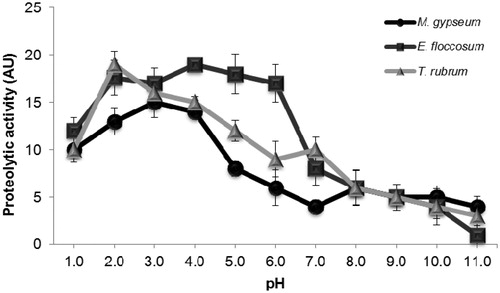
Figure 2. Inhibition of peptidase and keratinase activities by L. alba EO. The control activities (171 AU/mL for BSA and 196 AU/mL for keratin) are each set as 100%. The values represent the means of three independent experiments performed in triplicate. The error bars represent the standard error of the mean.
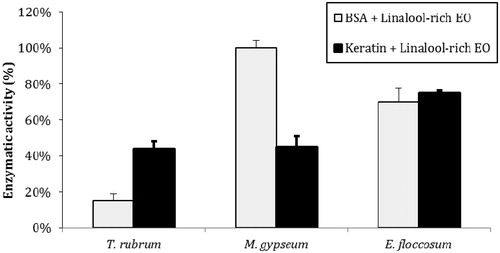
Figure 3. Effects of L. alba EO on the peptidase activity of T. rubrum, M. gypseum and E. floccosum culture supernatant extracts. BSA was used as a control. T0: control in which the reaction mixture (containing enzyme extract and keratin) was subjected to SDS-PAGE without incubation. T6: reaction mixture after six hours of incubation at 37 °C. T24: reaction mixture after overnight incubation at 37 °C. EO: reaction mixture containing L. alba EO after overnight incubation at 37 °C. The molecular weights of the proteins (in kDa) are provided at the left.
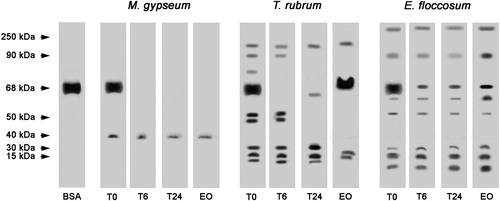
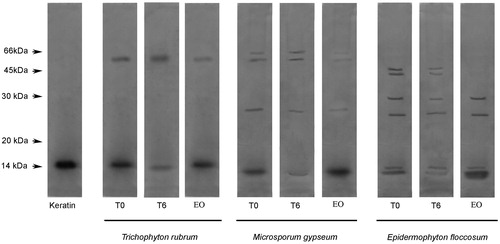
Figure 4. Enzymatic activity analysis using feather keratin as a substrate. T0: control in which the reaction mixture (containing dermatophyte culture supernatant enzyme extract and keratin) were subjected to SDS-PAGE without incubation. T6: reaction mixture after six hours of incubation. EO: reaction mixtures containing L. alba EO after six hours of incubation. The degradation profile was analyzed by 12% SDS-PAGE. The molecular weights of the proteins (in kDa) are provided at the left.