Figures & data
Figure 1. FT-IR spectra of: G. robertianum polyphenolic extract (1), H. purpurascens polyphenolic extract (2) and H. officinale polyphenolic extract (3).
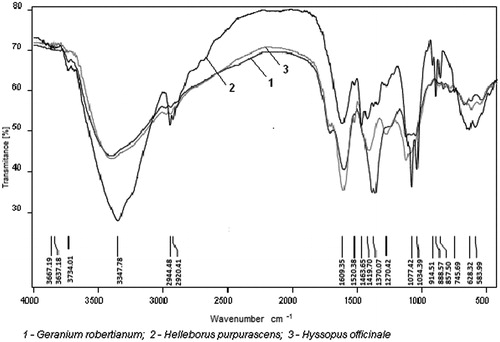
Table 1. Contents of total phenolics, total flavonoids and tannins in Geranium spp., Helleborus spp. and Hyssopus spp. polyphenolic extracts.
Table 2. Retention time, regression equations, correlation coefficients, linear ranges and LD for phenolic compounds from Geraniumv spp., Helleborus spp. and Hyssopus spp. extracts.
Table 3. Phenolic acids and flavonoid contents in G. robertianum, H. purpurascens and H. officinale polyphenolic extracts.
Figure 2. Urease inhibition activity of Geranium spp., Helleborus spp. and Hyssopus spp. polyphenolic extracts (concentration of each herbal extract: 1.5 mg/mL).
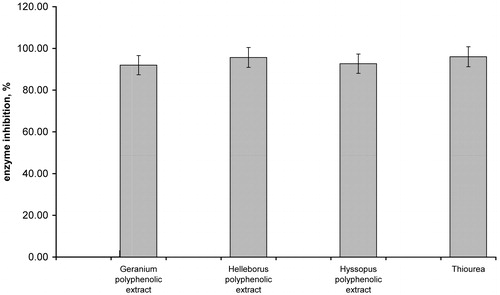
Figure 3. α-Chymotrypsin inhibition activity of Geranium spp., Helleborus spp. and Hyssopus spp. polyphenolic extracts (concentration of each herbal extract: 1.5 mg/mL).
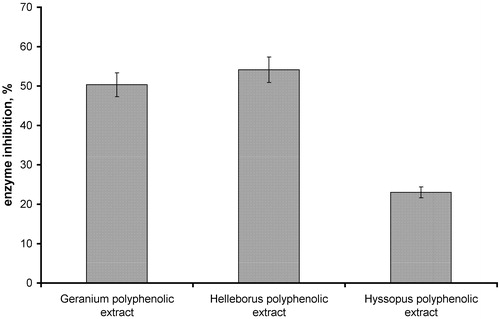
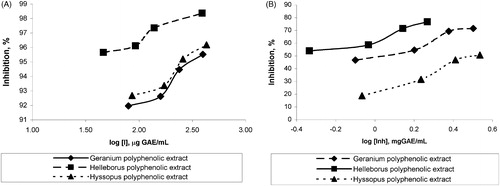
Figure 4. The effect of polyphenolic extracts on kinetic plots of urease (A) and α-chymotrypsin (B).
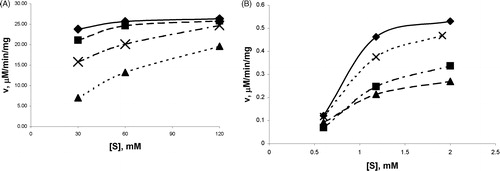
Figure 5. Lineweaver–Burk plots of: (A) urease and (B) a-chymotrypsin inhibition by polyphenolic extracts in the absence (♦) or presence of H. purpurascens (▴), G. robertianum (▪) and H. officinale (×).
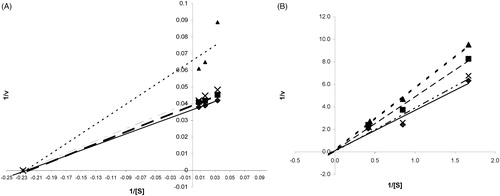
Figure 6. Inhibition of urease (A) and a-chymotrypsin (B) activities by polyphenolic extracts (concentration of each herbal extract: 1.5 mg/mL).