
Figures & data
Figure 1. Chemical structures of isolated PLpro inhibitors 1–6.
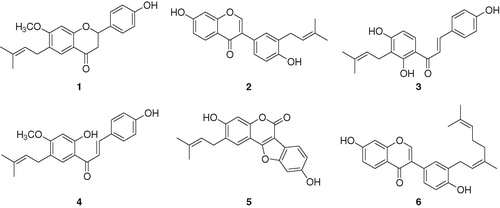
Figure 2. (A) Effects of isolated compounds 1–6 on SARS-CoV PLpro for the hydrolysis of Z-RLRGG-AMC, (B) the catalytic activity of SARS-CoV PLpro as a function of enzyme concentration at different concentrations of compound 5 and (C–H) Dixon plots for the inhibition of compounds (1–6), respectively, on the hydrolysis activity of PLpro in the presence of different concentrations of substrate.
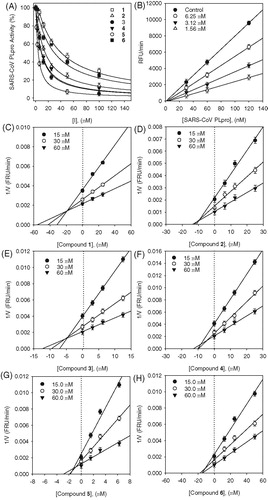
Figure 3. (A–B) Kinetic assays of SARS-CoV PLpro inhibition by isobavachalcone (3) and psoralidin (5). Lineweaver–Burk plots were constructed for the inhibition of SARS-CoV PLpro by compounds (3 and 5). The plot is expressed as 1/velocity versus 1/PLpro (nM−1) with or without inhibitor. Insets (I) and (II) represent the secondary plot of the slope and the intercept of the straight lines versus concentration of compounds (3 and 5), respectively.
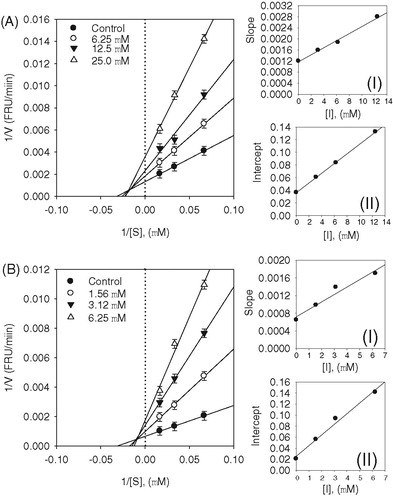
Table 1. Inhibitory effects of compounds 1–6 on PLpro activity.