
Figures & data
Figure 1. Overall scheme of the work.
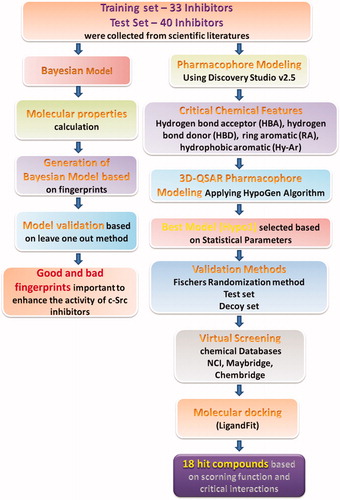
Figure 2. Chemically diverse 33 compounds used as training set in 3D-QSAR Pharmacophore generation (Discovery Studio). IC50 values are indicated in parentheses for each compound.
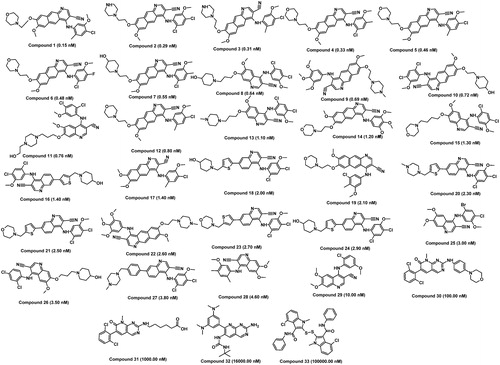
Table 1. Information of statistical significance values are presented in cost values measured in bits for the top 10 hypotheses as a result of automated 3D-QSAR pharmacophore generation.
Figure 3. Hypo1 pharmacophore model with its geometric constrains: hydrogen bond acceptor (HBA, green), hydrogen bond donor (HBD, magenta), hydrophobic aromatic (Hy-Ar, blue) and ring aromatic (RA, brown).
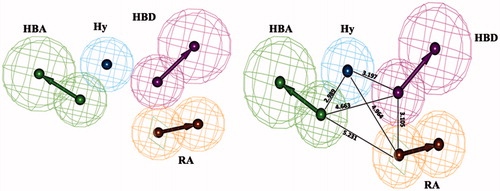
Table 2. Distance between every two features of Hypo1.
Table 3. Actual and estimated activity values of the training set molecules based on the pharmacophore model Hypo1.
Figure 4. Best pharmacophore model Hypo1 aligned to a training set compound. (a) Active molecule compound 1 (IC50: 0.15 nM) and (b) inactive molecule compound 33 (IC50: 100 000 nM). Hydrogen bond acceptor (HBA, green), hydrogen bond donor (HBD, magenta), hydrophobic aromatic (Hy-Ar, blue) and ring aromatic (RA, brown).
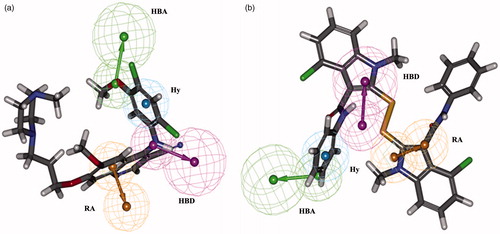
Figure 5. The difference in costs between HypoGen runs and the scrambled runs. The 98% confidence level was selected.
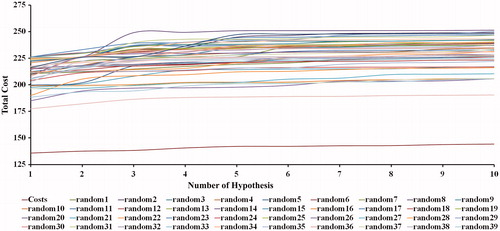
Figure 6. 2D structure of the test set molecules used in the validation of Hypo1.
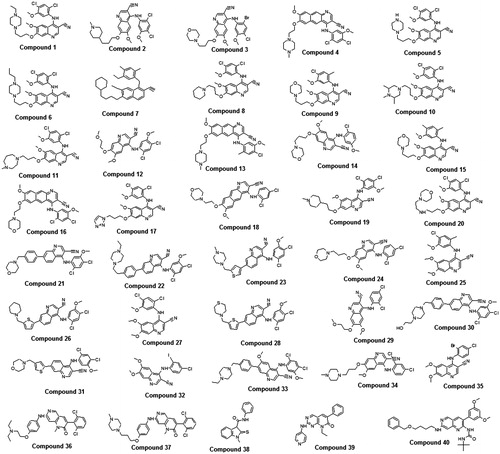
Table 4. Experimental and predicted IC50 data values of 40 test set molecules against Hypo1.
Table 5. Statistical parameter from screening test set molecules.
Figure 7. Molecular-docking result. (a) NCI compound, (b) Chembridge compound, (c) Maybridge and (d) Maybridge hit compound bound in the active site of c-Src. Hydrogen bonds are shown in black.
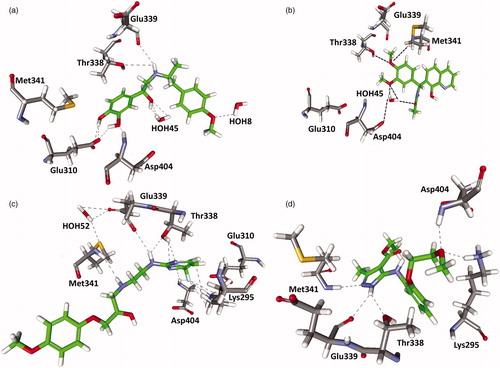
Figure 8. Suitable molecular fragment for c-Src inhibitor obtained from the Bayesian model.
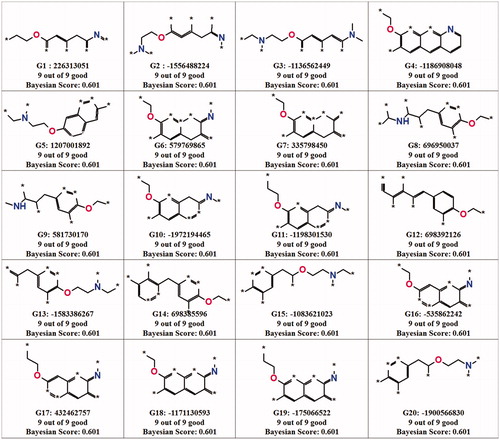
Figure 9. Non-suitable molecular fragment for c-Src inhibitor obtained from the Bayesian model.
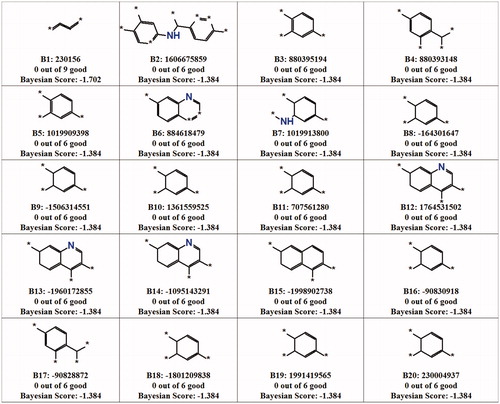
Figure 10. Receiver operating characteristic (ROC) plot of Bayesian model for c-Src inhibitors.
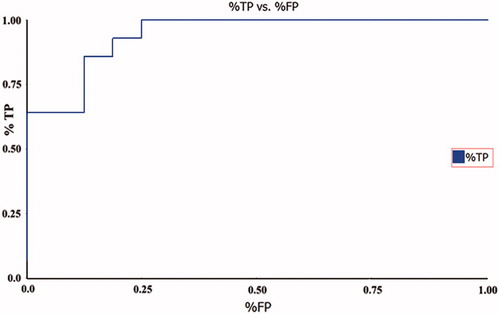
Table 6. Statistical value obtained from the Bayesian model.