
Figures & data
Figure 1. SET mechanisms proposed by Silverman et al.Citation16–21.
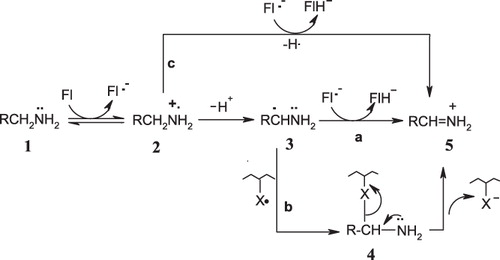
Figure 2. MAO-B inhibitors studied by Silverman et al.Citation34–41.
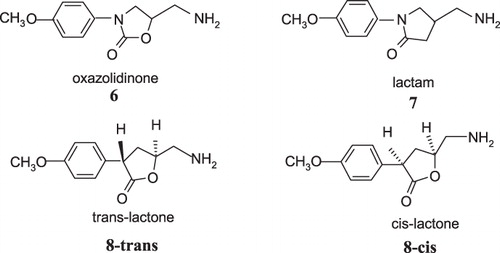
Figure 3. Reactions modeled to mimic the dissociation of the hypothetical enzyme-inhibitor covalent adducts. Both cis and the trans isomers were modeled for adducts 9–12.
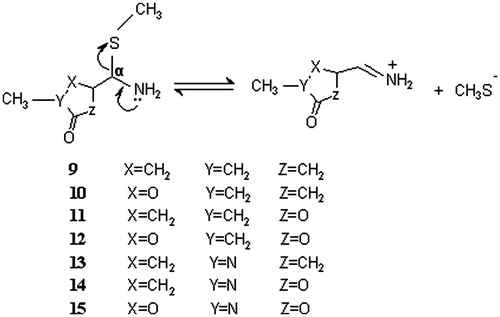
Figure 4. IRC plot for the dissociation reaction of model adduct 14.
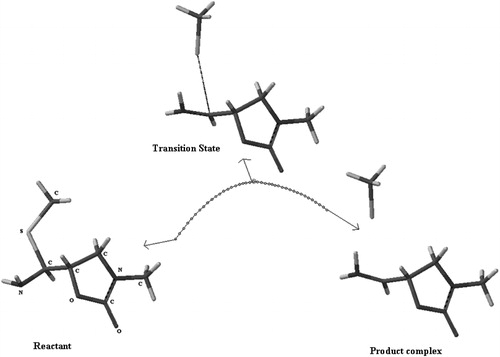
Table 1. The length (Å) of breaking and forming bonds for reactants and transition states optimized at B3LYP/6-31G* level and imaginary frequencies of the transition states.
Table 2. Activation energies (kcal/mol) calculated at HF/6-31G* level in gas and aqueous phases, solvation energies (within parentheses) and calculated rate constants (s−1) in aqueous phase.
Table 3. Activation energies (kcal/mol) calculated at B3LYP/6-31G* level in gas and aqueous phases, solvation energies (within parentheses) and calculated rate constants (s−1) in aqueous phase.