
Figures & data
Figure 1. Crystal structure of the GEF domain of SopE in complex with Cdc42, shown in cartoon representation (PDB id: 1gzs:A,B). Switch regions of Cdc42 are shown in red and purple. Critical GAGA loop residues are shown in yellow.
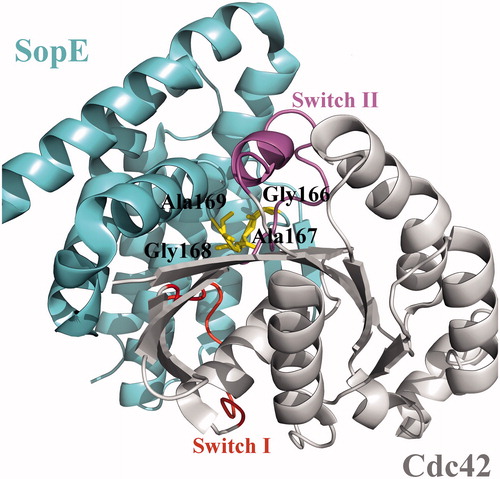
Figure 2. Schematic workflow of VS and docking of SopE.
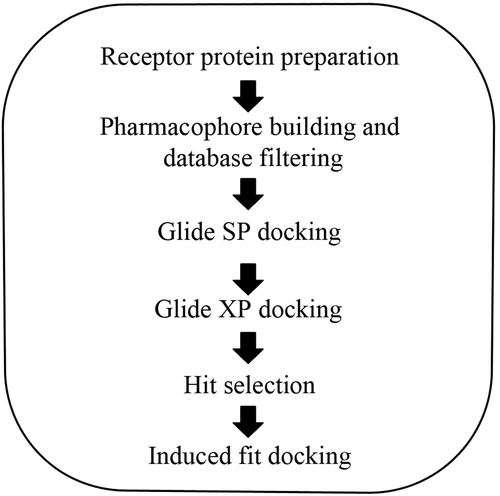
Figure 3. (A) Binding modes of all fragments superimposed at the binding site of SopE in stick representation. (B) Pharmacophore site points as spheres located on the binding site of SopE, determined by E-pharm. Top six sites based on energetic contribution are labeled. All site points are colored and labeled according to their feature type (donor, acceptor, hydrophobic or ring).
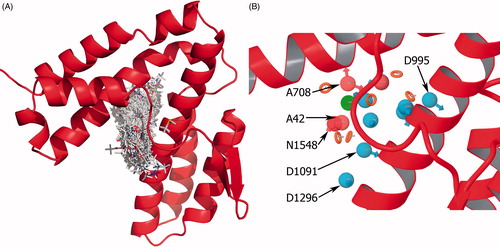
Table 1. Pharmacophore features and ranks by E-pharm. Numbers in feature labels are indices which are automatically assigned during feature generation.
Table 2. Docking results of top 20 hits in kcal/mol. ZINC IDs and strain corrected GlideScores for proposed inhibitors are indicated by (*).
Table 3. ADME and druglikeness properties of the selected ligands by QikProp.
Figure 4. (A)–(E) Glide XP binding modes of proposed molecules S1–S5 at SopE binding site. SopE is shown in ribbon representation. Ligands and SopE residues interacting with the ligand are shown in stick representation, colored by atom type. Hydrogen bonds between ligands and SopE are indicated by black dashed lines. (F) Binding mode overlay of five proposed molecules. SopE binding site is in surface representation and ligands are in stick representation, colored by molecule.
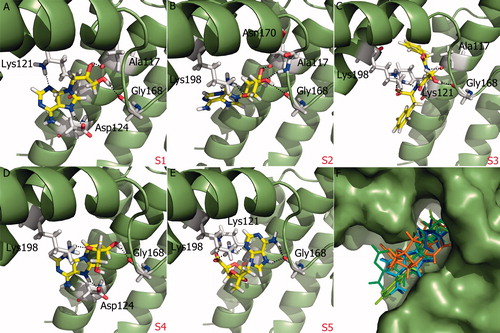
Table 4. Summary of H-bond interactions between and proposed molecules of SopE. “+” sign indicates presence of a hydrogen bond and number of signs indicates the number of hydrogen bonds between ligand and a particular SopE residue.
Figure 5. (A)–(E) IFD binding modes of proposed molecules S1–S5 at SopE binding site. SopE is shown in ribbon representation. Ligands and SopE residues interacting with the ligand are shown in stick representation, colored by atom type. Hydrogen bonds between ligands and SopE are indicated by black dashed lines. (F) Binding mode overlay of five proposed molecules. SopE binding site is in surface representation and ligands are in stick representation, colored by the molecule.
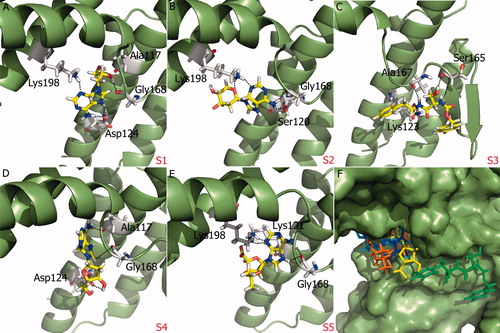
Table 5. IFD Score of proposed molecules in kcal/mol. Docking score of the best pose is presented for each ligand.
Table 6. Docking results of proposed SopE inhibitors to SopE2 in kcal/mol.