
Figures & data
Table 1. Clinical data of groups R, L and P subjects undergoing HBO therapy.
Figure 1. The comparison of ulcer sizes at three time-points in each group including RLA + HBO treated (group R), LA + HBO treated (group L) and placebo + HBO treated (group P). The ulcer sizes were determined before (T0), after 20(T20) and 40(T40) days from starting the HBO therapy. The results were expressed as cm2 and data represent mean ± SD. As shown in this figure, the ulcer sizes became smaller in group R at both T20 and T40 significantly compared with its basal value T0. Simultaneously, only the results of T40 in groups L and P expressed improvement in ulcer size. *p < 0.05. Group R: n = 10; group L: n = 10; and group P: n = 6.
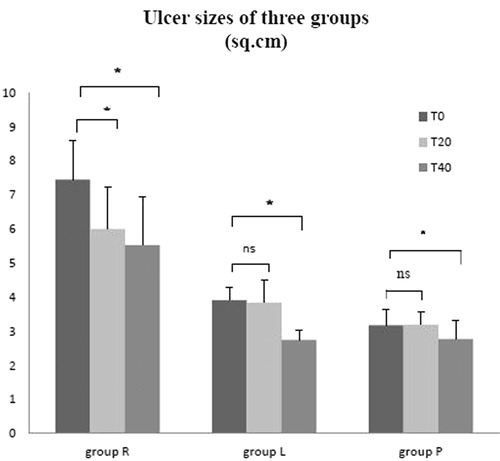
Figure 2. The comparison of ulcer sizes among the three groups at T20 and T40, respectively. The results were expressed as variation of the percentage in ulcer sizes and related to the basal value (T0), whereas the data represent mean ± SD. At T20, variation of the percentage of ulcer size in group R was significantly higher than that in groups L and P. Concurrently, the value in group L made no difference referred to group P. At T40, although there was no difference between groups R and L, both of them showed more effective in decreasing the areas of ulcer than group P. *p < 0.05 and **p < 0.01. Group R: n = 10; group L: n = 10; and group P: n = 6. T20 and T40 means after 20 and 40 d from starting the HBO therapy, respectively.
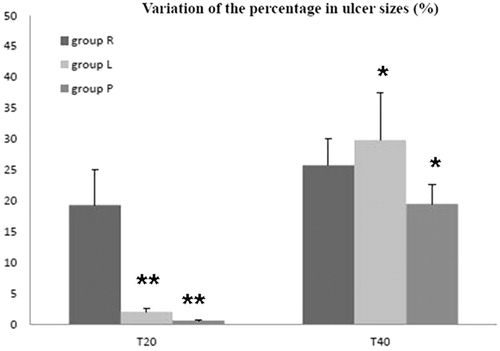
Table 2. Mean values (+/− SD) of IL-6, TNF-α, EGF and VEFG in experimental groups at different experimental times.