
Figures & data
Figure 1. Molecular structure of both naproxen (A) and cromolyn (B).
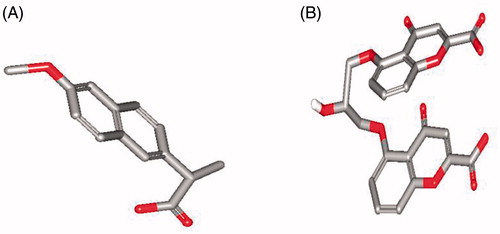
Figure 2. Pictures of Caco2, HepG2, MCF7, Hela, A5W9 and Hep2 cell lines before inhibition.
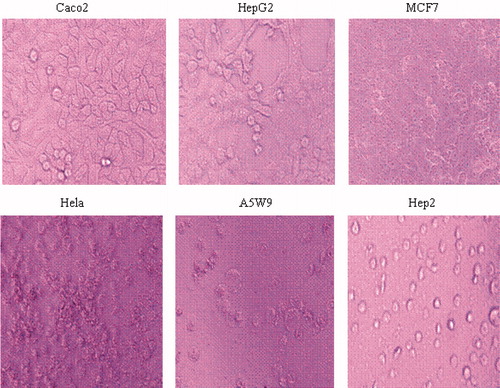
Figure 3. Effects of treatment with naproxen different concentrations and the control DMSO against in vitro proliferation (survival fraction percentage) of Caco2, HepG2, MCF7, Hela, A5W9 and Hep2 cell lines. Mean survival fraction percentage ± SD are the presented data and (*) p value < 0.05 compared to control.
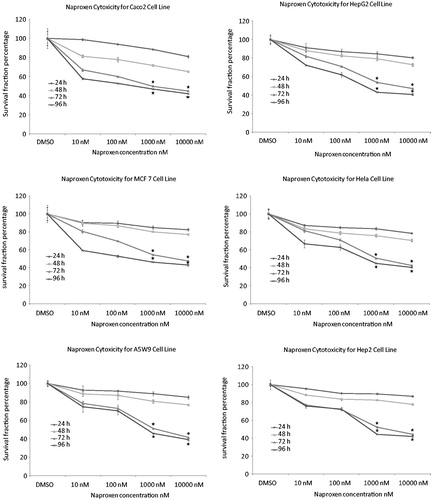
Figure 4. Effects of treatment with cromolyn different concentrations and the control DMSO against in vitro proliferation (survival fraction percentage) of Caco2, HepG2, MCF7, Hela, A5W9 and Hep2 cell lines. Mean survival fraction percentage ± SD are the presented data and (*) p value < 0.05 compared to control.
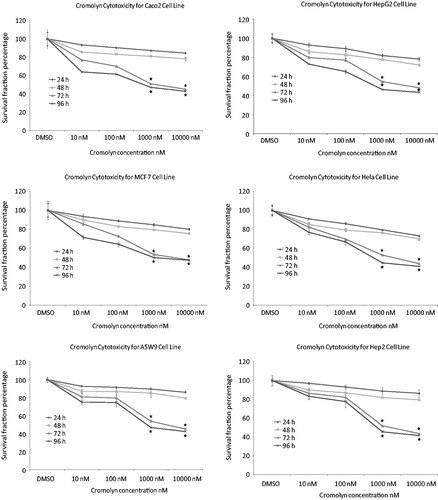
Figure 5. Effects of treatment with Known GSK3β inhibitor LiCl different concentrations and the control DMSO against in vitro proliferation (survival fraction percentage) of Caco2, HepG2, MCF7, Hela, A5W9 and Hep2 cell lines. Mean survival fraction percentage ± SD are the presented data and (*) p value < 0.05 compared to control.
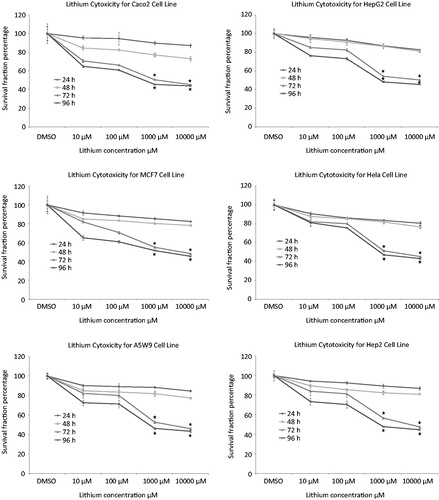
Figure 6. Effects of treatment with naproxen, cromolyn and LiCl highest concentrations 10000 nM and the control DMSO after 96 h on in vitro apoptosis (A) of Caco2, HepG2, MCF7, Hela, A5W9 and Hep2 cell lines and human p53 concentrations for the same conditions and (B) mean ± SD are the presented data and (*) p value < 0.05 compared to control.
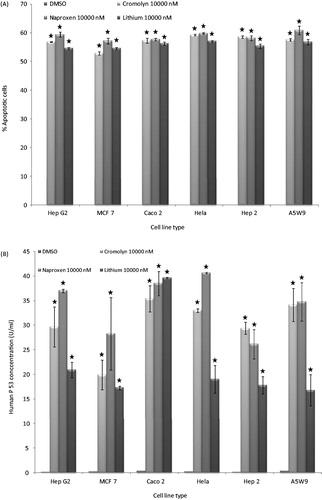
Figure 7. Effects of treatment with naproxen, cromolyn and LiCl highest concentrations 10 000 nM and the control DMSO after 96 h on in vitro relative survivin (A) and caspase3 (B) genes expression of Caco2, HepG2, MCF7, Hela, A5W9 and Hep2 cell lines.
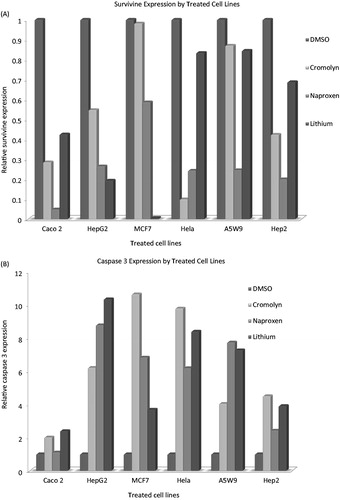
Figure 8. Agarose gel electrophoresis bands of survivin (A) and caspase3 (B) genes after treatment with naproxen, cromolyn and LiCl highest concentrations 10 000 nM and the control DMSO for 96 h on Caco2, HepG2, MCF7, Hela, A5W9 and Hep2 cell lines.
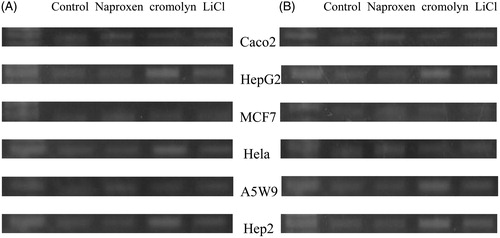
Table 1. Cell viability (number) of GSK3β inhibitors against different cell lines by Trypan blue assay after 72 and 96 h.
Table 2. Cytotoxicities (IC50 in μM for naproxen and cromolyn, while LiCl in mM) of GSK3β inhibitors against different cell lines after 72 and 96 h by MTT proliferation assay.