Figures & data
Figure 1. Structure of sodium cholesterol sulfate (CS).
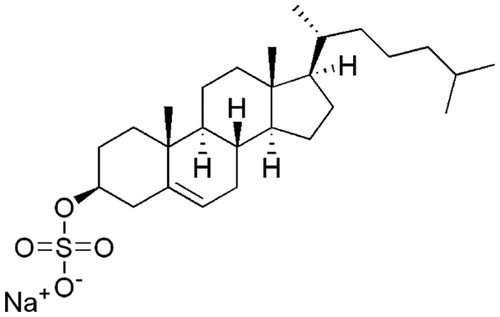
Figure 2. Dose–response curve for the inhibition of NS3 helicase by CS. NS3 helicase activity was measured by PET assay. NS3 helicase activity of the sample with CS was calculated relative to that of the control sample without the inhibitor but with DMSO. The data are presented as the mean ± standard deviation for three replicates. The solid and dashed lines indicate the curve fittings in which h = 3.9 and 1, respectively.
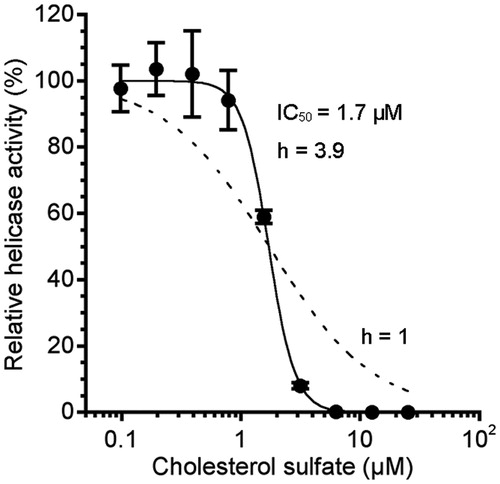
Figure 3. Inhibition of NS3 helicase by CS. (A) Autoradiography of RNA unwinding assay with 32P-labeled RNA. The heat-denatured single-strand RNA (26-mer) and the partial duplex RNA substrate were applied to lanes 1 and 2, respectively. The duplex RNA was reacted with NS3 (300 nM) in the presence of CS (lanes 3–7, 0–20 μM). The resulting samples were subjected to native polyacrylamide gel electrophoresis. (B) Graphical representation of the experiment shown in (A). NS3 helicase activity was calculated as the ratio of signal intensity derived from the ssRNA in the sample with CS to that of the control sample without the inhibitor but with DMSO. The solid and dashed lines indicate the curve fittings in which h = 1.8 and 1, respectively.
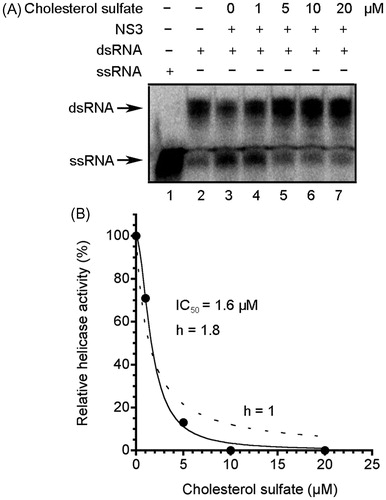
Figure 4. Compounds with structurally similar properties to CS used in this study.
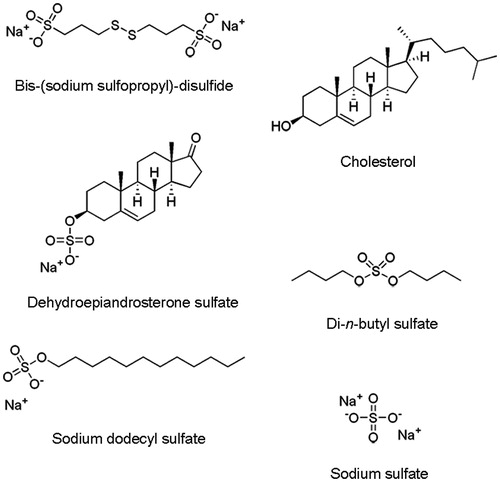
Table 1. Effects of CS and the structurally related compounds on NS3 helicase activity.*
Figure 5. Effect of CS on NS3 ATPase activity. (A) Autoradiography of ATPase assay with [γ-32P] ATP. Lane 1 contains the control reaction mixture in the absence of NS3. Lanes 2–5 show the ATP hydrolysis reaction at increasing concentrations of CS with poly (U) ssRNA. (B) Graphical representation of the experiment shown in (A). ATPase activity was calculated as the ratio of the signal intensity derived from the released Pi in the sample with CS to that in the control sample without the inhibitor but with DMSO. The data are presented as the mean ± standard deviation for two replicates.
![Figure 5. Effect of CS on NS3 ATPase activity. (A) Autoradiography of ATPase assay with [γ-32P] ATP. Lane 1 contains the control reaction mixture in the absence of NS3. Lanes 2–5 show the ATP hydrolysis reaction at increasing concentrations of CS with poly (U) ssRNA. (B) Graphical representation of the experiment shown in (A). ATPase activity was calculated as the ratio of the signal intensity derived from the released Pi in the sample with CS to that in the control sample without the inhibitor but with DMSO. The data are presented as the mean ± standard deviation for two replicates.](/cms/asset/3125ed1d-54ef-4fdc-b1d4-bae412c19df7/ienz_a_766607_f0005_b.jpg)
Figure 6. Effect of CS on NS3 RNA binding activity. (A) Autoradiography of gel mobility shift assay with 32P-labled ssRNA. Lanes 1 and 2 contain the control reaction mixtures with heat-denatured ssRNA alone or 300 nM bovine serum albumin (BSA) instead of NS3, respectively. Lanes 3–9 show the binding of NS3 helicase to ssRNA at increasing concentrations of CS. (B) Graphical representation of the experiment shown in (A). RNA binding activity was calculated as the ratio of signal intensity derived from the NS3–ssRNA complex in the sample with CS to that of the control sample without the inhibitor but with DMSO. The data are presented as the mean ± standard deviation for two replicates.
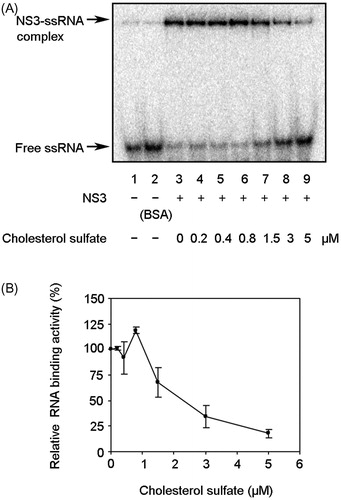
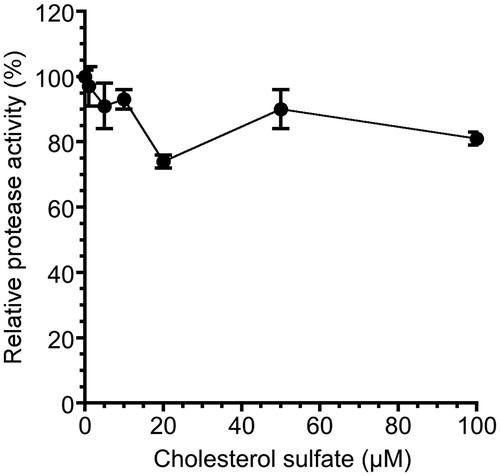
Figure 7. Effect of CS on NS3 serine protease activity. NS3 serine protease activity of the sample with CS was calculated relative to that of the control sample without the inhibitor but with DMSO. The data are presented as the means ± standard deviation for three replicates.