Figures & data
Figure 1. Molecular structures of Compounds 1–5.
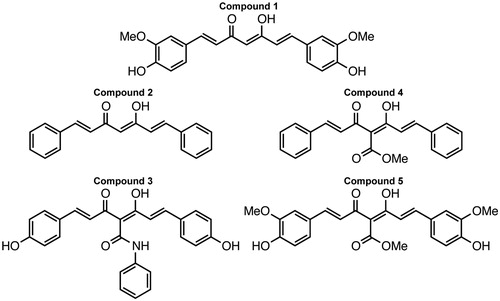
Figure 2. (A) Lethal factor activity as measured by fluorescence generated over time. 100 nM lethal factor, 3 μM substrate and 20 μM inhibitors were used uniformly. Assay buffer was used in place of inhibitor as a control. (B) Percent residual activity of 100 nM lethal factor and 3 μM substrate after incubation with 20 μM inhibitors. All experiments were performed in triplicate. R2 values for all data exceeded 0.99, as determined by Levenberg–Marquardt linear regression analysis, indicating a high level of goodness-of-fit.
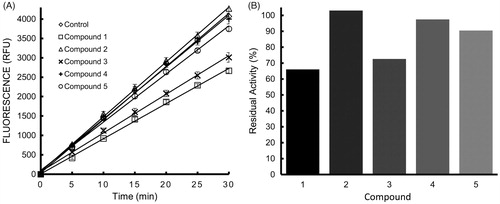
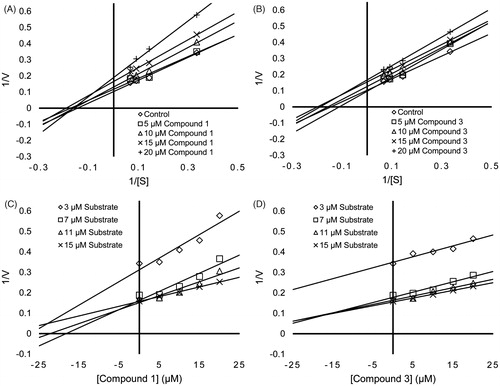
Figure 3. Lineweaver–Burk and Dixon plots of 100 nM lethal factor activity over four substrate concentrations and four inhibitor concentrations. (A) Lineweaver–Burk plot for Compound 1, (B) Lineweaver–Burk plot for Compound 3, (C) Dixon plot for Compound 1 and (D) Dixon plot for Compound 3.