
Figures & data
Figure 1. Structural sketch map of PLA.
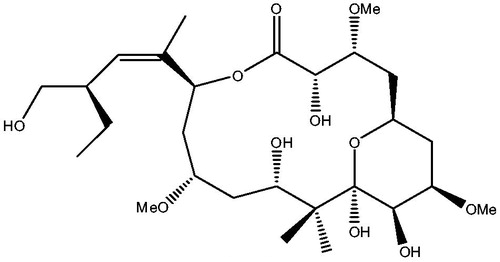
Figure 2. The three possible binding sites 1, 2 and 3 predicted by global dockings, in which tubulin protein (1TVK) is shown as ribbon and PLA is shown as stick colored by element.
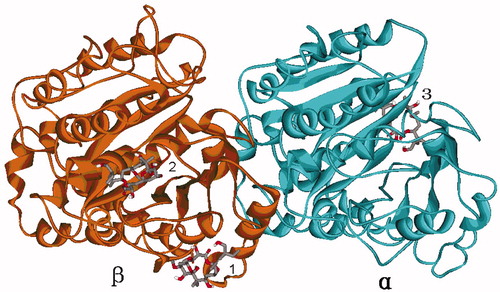
Table 1. The number of conformations and the lowest binding energy in each of the binding sites 1, 2 and 3.
Figure 3. The predicted binding sites 1 (A), 2 (B) and 3 (C) of PLA in tubulin by global dockings.
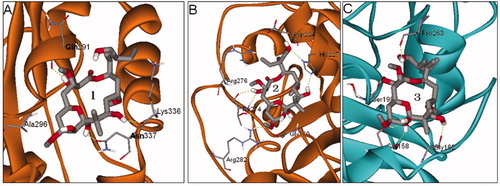
Figure 4. Docking conformations of PLA and corresponding surfaces of tubulin at binding sites 1 (A and B), 2 (C and D) and 3 (E and F), in which the red and blue regions represent oxygen and nitrogen atoms, respectively, whereas gray and white regions represent carbon and hydrogen atoms (as a whole).
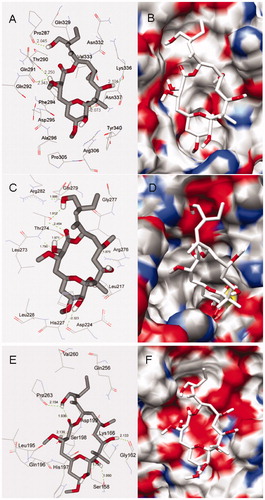
Figure 5. Potential energy (bottom) and total energy (top) evolutions of binding modes 1 (black), 2 (blue) and 3 (red) during the MD simulations (A). RMSD of backbone atoms of β-tubulin (black) and PLA (red) in binding modes 1 (B), 2 (C) and 3 (D), respectively.
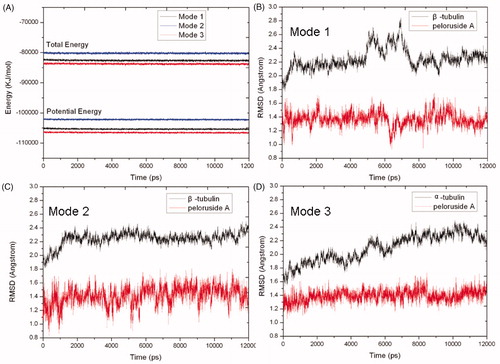
Figure 6. The final (yellow) and initial (gray) structures of binding modes 1(A), 2 (B) and 3 (C) in 12.0 ns MD simulations, respectively.
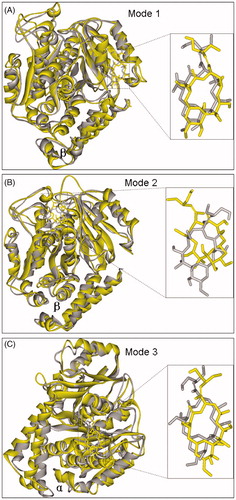
Figure 7. The final binding modes 1(A), 2 (B) and 3 (C) after 12.0 ns MD simulations, respectively.
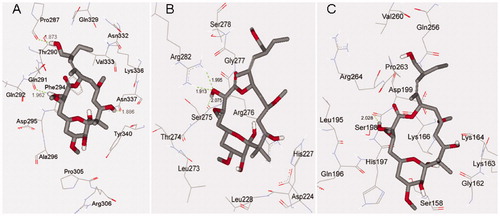
Table 2. Binding free energies (kcal/mol) obtained by MM-PBSA method for the 500 snapshots of the last 1.0 ns MD simulations.