Figures & data
Figure 1. Purification of protein showing retinol dehydrogenase activity and cellular retinoid binding proteins from cytosol of human thyroid glandular cells. A: 100 μL cytosol (1.0 × 10⁶ cells) were gel filtered on a KW 804 column and eluted at 1 mL min−1 with 50 mM Tris HCl pH 7.4 containing 1 mM glutathione. Elution peaks were monitored by absorbance at 280 nm (top trace) and fluorescence (Ex 350 nm/Em 470 nm − bottom trace). Iterative analyses were carried out and fraction peaks were collected from the area containing XDH (Fraction I; RT 5.94 ± 0.3) or cellular retinoid binding proteins (Fraction II; RT 11.7 ± 0.3) (grey peaks). Positions of molecular weight markers were: (1) blue dextran (2.000 kDa); (2) β-amylase (200 kDa); (3) bovine serum albumin (66 kDa); (4) bovine erythrocytes carbonic anhydrase (29.3 kDa); (5) horse heart cytochrome C (12.4 kDa). B: 100 μL of concentrated Fraction I were gel filtered again on KW 804 column and several peaks were obtained. Iterative analyses were carried out and peaks containing XDH were collected and concentrated (Peak a; RT 5.94 ± 0.3). The elution profile shows a first peak (a), relative to the purified XDH, and peaks identifiable as lytic products of XDH (b, c, d) and CRBP(s) (see Purification and identification of xanthine dehydrogenase and CRBP(s) in Results section).
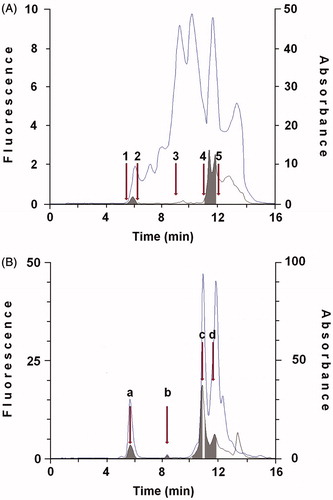
Figure 2. Gel permeation chromatography of CRBP(s) bound to 3[H]-all-trans-retinol or 3[H]-all-trans -retinoic acid. In the Protein Pak I60 chromatograms, grey areas are radioactive peaks, and light areas are absorbance at 280 nm. In the chromatograms of CRBP-3[H]-all-trans-retinol (A) and CRABP-3[H]-all-trans-retinoic acid (B), radioactivity relative to the bound atROL or atRA was distributed in one big peak. Both the chromatographic profiles also show two small peaks, probably due to nonspecific binding. Results from one representative of three separate experiments are shown.
![Figure 2. Gel permeation chromatography of CRBP(s) bound to 3[H]-all-trans-retinol or 3[H]-all-trans -retinoic acid. In the Protein Pak I60 chromatograms, grey areas are radioactive peaks, and light areas are absorbance at 280 nm. In the chromatograms of CRBP-3[H]-all-trans-retinol (A) and CRABP-3[H]-all-trans-retinoic acid (B), radioactivity relative to the bound atROL or atRA was distributed in one big peak. Both the chromatographic profiles also show two small peaks, probably due to nonspecific binding. Results from one representative of three separate experiments are shown.](/cms/asset/81eab19c-0b7c-4e92-afd6-59c19bf61595/ienz_a_855928_f0002_b.jpg)
Figure 3. Western blot analysis of HTGC cytosol and XDH purified fraction. SDS-PAGE electropherogram relative to pre-stained standard proteins (Std), HTGC cytosol (Cyt) (input, 1% of the cytosol) stained with red Ponceau (Panel 1), is compared to Western blot of buttermilk XO (XO), Std, and the XDH purified fraction (IB, Western blotting; input, 1.7% of the Fraction I), immunostained with XO antibody, and detected by chemiluminescence (Panel 2). One representative of at least three independent experiments are shown.
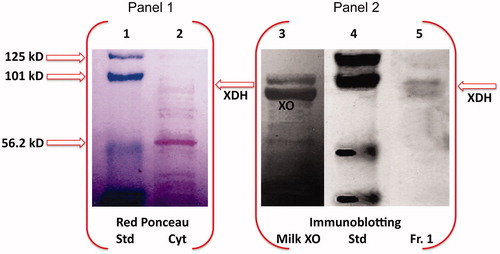
Table 1. Content of xanthine dehydrogenase in human thyroid glandular cells.
Table 2. Rates of retinoic acid biosynthesis rates in human thyroid glandular cells.
Figure 4. Comparison between the inhibitory effects of oxypurinol on the oxidation of xanthine or on all-trans-retinol in human thyroid glandular cells. Xanthine dehydrogenase purified from HTGC cytosol was assayed with 8 μM xanthine or 200 nM atROL bound to CRBP(s) at oxypurinol concentration of 0.5–8 μM. The inhibitory effect of oxypurinol against xanthine was already distinguished at the lowest concentration (0.5 μM) (p < 0.05 versus control) and was fully expressed at 4 μM concentration (p < 0.01 versus control). The inhibitory effect observed against atROL bound to CRBP(s) was instead accomplished at a higher oxypurinol concentration (8 μM) (p < 0.01 versus control). Results from a representative of three separate experiments are shown, reported as the mean ± SEM of triplicate determinations. Statistical significance, calculated with Student’s paired t-test, refers to a comparison of sample incubated with or without oxypurinol.
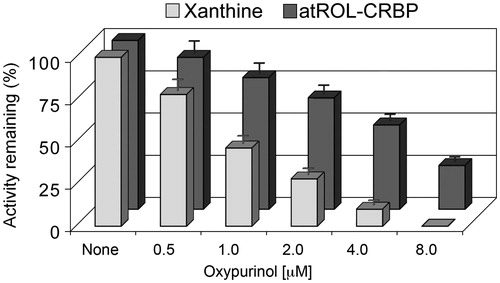
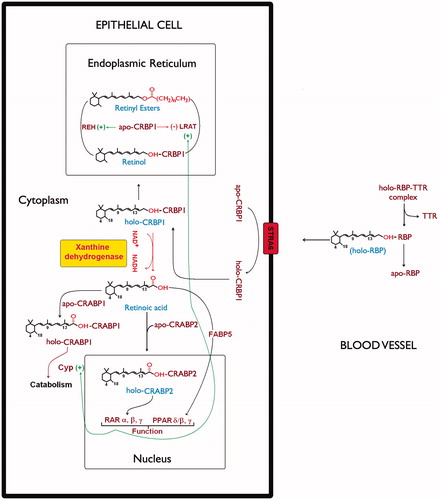
Figure 5. Xanthine dehydrogenase involvement in retinol/retinoic acid homeostasis in epithelial cells. The scheme describes retinoid metabolism in the different cellular compartments. In the cell plasma membrane retinol exchange between apo-CRBP1 and holo-RBP is mediated by STRA6 receptor (Stimulated by Retinoic Acid 6)Citation50. In the endoplasmic reticulum, the relative ratio of holo-CRBP1 to apo-CRBP1 is influenced by retinyl ester hydrolase (REH) or by lecithin retinol acyltransferase (LRAT). On the other hand, the apo-CRBP1, through its modulating action reduces their activity by regulating the cellular levels and fluxes of retinol. In cells that do not express any RDH activity, xanthine dehydrogenase interacting with holo-CRBP1 catalyzes retinol oxidation to retinoic acid, which is then released by interaction with CRABP1 and/or CRABP2. Such a hypothetical scheme of reaction mechanism devised by xanthine dehydrogenase to oxidize retinol to retinoic acid has been described in our previous articleCitation19. Delivery of atRA to distinct nuclear receptors or for catabolism involves atRA binding proteins, CRABP1, CRABP2, and FABP5.