Figures & data
Figure 1. Ginsenosides and amino acid residue hydrogen bond formation. Complex structures of (a) F2, (b) Ck, (c) Rg3 and (d) Re with the PPARγ active site residue after bond formation.
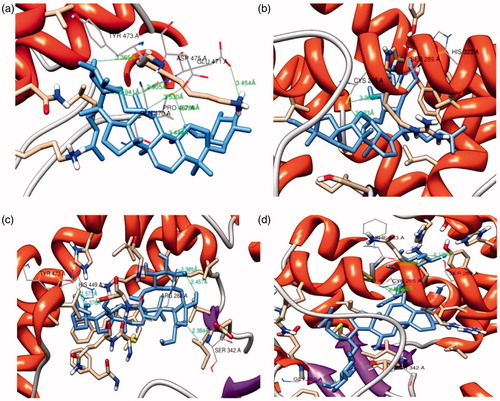
Table 1. Binding affinity prediction of PPARγ with ginsenoside F2, Ck, Rg3 and Re.
Table 2. Predicted biological activity (Pa > 0.7) of the selected ginsenosides from Panax ginseng.
Figure 2. The effect of ginsenoside F2 on 3T3-L1 adipocyte differentiation. The measurement of the cytotoxic activity of compound F2 at different concentration was done by MTT assay after treatment for 48 h (a). Lipid content was visualized by Oil Red O staining on day 8 of differentiation at the concentrations of 10, 50 and 100 µM (b), followed by lipid content evaluation by absorbance measurement (c). The data showed statistical significance ###p < 0.0005 between the control and positive control group, while **p < 0.005 was noted between positive and treated groups. F2 at 100 μM concentration showed to be extreme significantly different ***p < 0.0005 compared to the DMI treated positive control.
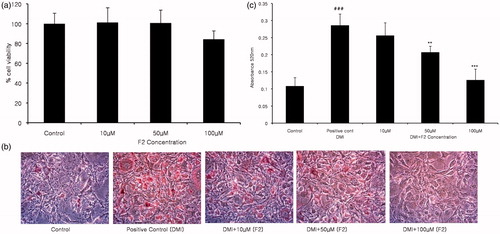
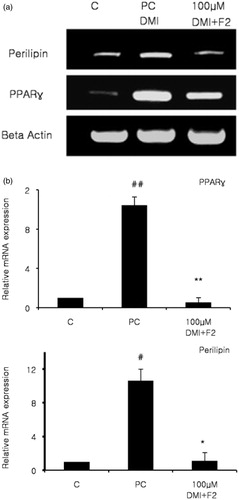
Figure 3. Effects of ginsenoside F2 on adipocyte markers were evaluated. At day 8 of differentiation total RNA was isolated. Control groups were treated with the normal medium, while the positive control received differentiation medium (DMI). Treated groups received differentiation medium with different F2 concentration (DMI + F2), while expression levels were evaluated by RT-PCR and visualized via gel (a). Gene expression levels were quantified using qRT-PCR and results analyzed (b). Presented data were statistically significant ##p < 0.005 between control and positive control, also **p < 0.005 compared between positive control and F2 concentration for PPARγ. #p < 0.05 compared with the normal control group and positive control, *p < 0.05 compared with DMI treated positive control and DMI and F2 treated for Perilipin.