Figures & data
Figure 1. Chemical structures of triapine (A), reported antitumor 1,3,4-oxadiazoles (B) and the synthesized compounds (C and D).
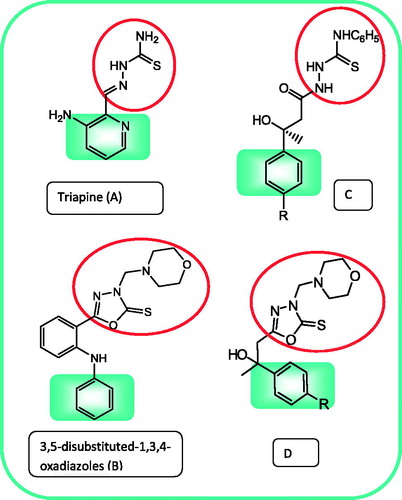
Scheme 1. Synthetic pathways for the target compounds. For 1–6: a, R = hydrogen; b, R = methyl; c, R = chloro. Reagents and conditions: (i) ethyl bromoacetate/Zn/benzene; (ii) NH2NH2.H2O/absolute ethanol/reflux; (iii) phenyl isothiocyanate/ethanol/reflux; (iv) CS2/KOH/reflux; (v) HCHO 40%/morpholine.
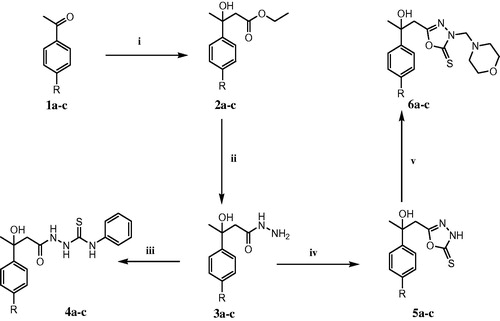
Figure 2. Thiosemicarbazides reduced cell viability and induced apoptosis in human MCF-7 breast cancer cells. (A) MCF-7 cells were treated with 100 µM of test compounds for 24 h. Cells without test compounds were used as controls. *p < 0.05 as compared to the mock-treated controls using unpaired Student t test. The bars represent the mean ± SD (n = 3). (B) MCF-7 and MCF-12a were treated with 100 µM of compounds 4a–c for 24 h. Untreated cells were used as controls. Each data point was an average of results from three independent experiments performed in triplicate and presented as mean ± SD (n = 3). Significant differences between the control and 4c are indicated by *(***p < 0.05). (C) Dose–response curve for compound 4c. A dose–response curve for 4c was constructed, and IC50 was determined to be 20 µM. Each data point was an average of results from three independent experiments performed in triplicate and presented as mean ± SD. (D) MCF-7 cells were treated with 20 µM of compound 4c for 24 h. Untreated cells were used as control (C). ELISA assay was applied for apoptotic cell detection. The bars represent the mean ± SD (n = 3). Significant differences between the control and 4c are indicated by *(*p < 0.05). (E) TUNEL staining of MCF-7 cells after exposure to compound 4c at a concentration of 20 µM for 24 h. Stained cells represent TUNEL positive cells, and the control cells (C) act as control for the staining procedure.
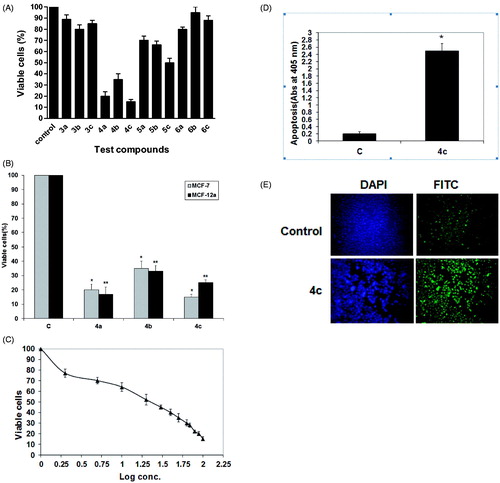
Figure 3. Impact of 4c on cell cycle and apoptotic signaling in MCF-7 cells. (A) Cells were treated as described under experimental. The % of cell cycle phases was determined in MCF-7 cells after treatment with 20 µM of 4c for 24 h. Each data point is the mean of three independent experiments and expressed as mean ± SD. Significant differences between the control and 4c are indicated by *(*p < 0.05, **p < 0.01). (B) A representative image of DNA histogram for control and treated cells with 20 µM of 4c for 24 h. (C) Cells were treated with 20 µM of compound 4c for 24 h. The cell lysates were collected, and the expression of Bcl-2, STAT-3, Akt, Bax, Bad and ERK1/2 was studied by Western blotting analysis using specific antibodies. β-actin was used as loading control. (C) Control (untreated cells).
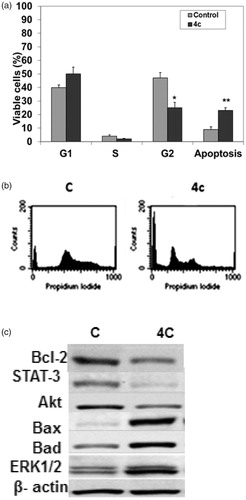
Figure 4. 4c increased the expression levels of JNK in MCF-7 cells. (A) MCF-7 cells were treated with 20 µM of 4c alone and with 20 µM of 4c and 10 µM of MEK1 inhibitor. Total protein was extracted for Western blot analysis to determine SAPK/JNK phosphorylation under different treatment conditions. Non-treated or mock-treated cells were used as control (C) and β-actin was used as loading control. (B) MCF-7 cells were treated with 20 µM of 4c alone and with 20 µM 4c and 10 µM SP600125. Induction of apoptosis was determined at 405 nm and compared to control (untreated cells). Each data point is the mean of three independent experiments and expressed as mean ± SD.
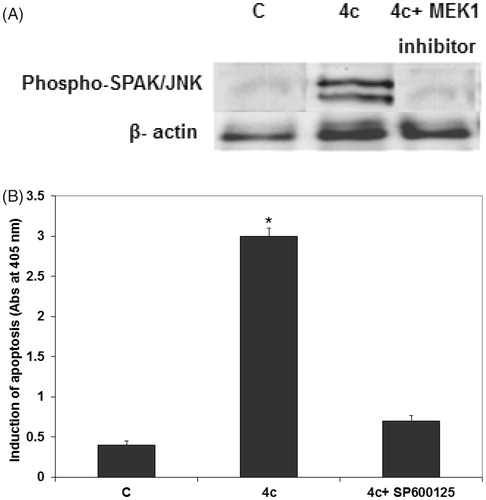
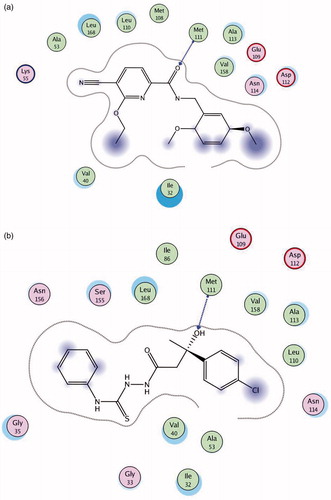
Figure 5. (A) Binding mode of pyridine carboxamide inhibitor in the binding site of JNK1 using MOE software. (B) Binding mode of compound 4c docked and minimized in the JNK1 binding site using MOE software.