Figures & data
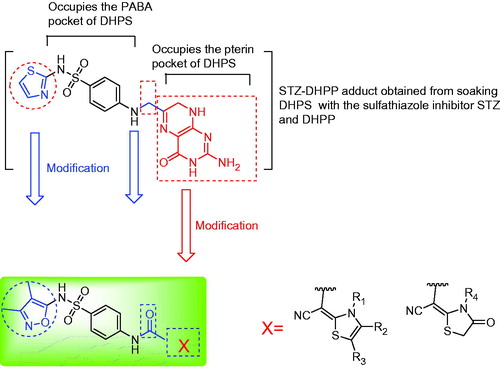
Figure 1. Design of thaizole derivatives bearing sulfisoxazole moiety as DHPS inhibitors.
Scheme 1. Synthetic route to functionalized thiazoles tagged with sulfisoxazole.
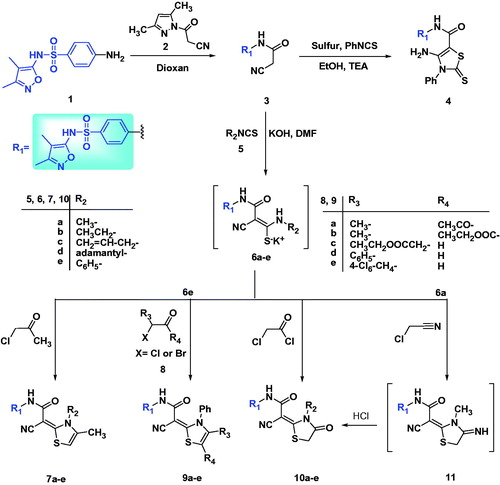
Table 1. Antibacterial inhibition zone in mm ± standard deviation and minimal inhibitory concentrations (MIC, µg/mL, between brackets) of some newly synthesized compounds.
Table 2. Antifungal inhibition zone in mm ± standard deviation and minimal inhibitory concentrations (MIC, µg/mL, between brackets) of some newly synthesized compounds.
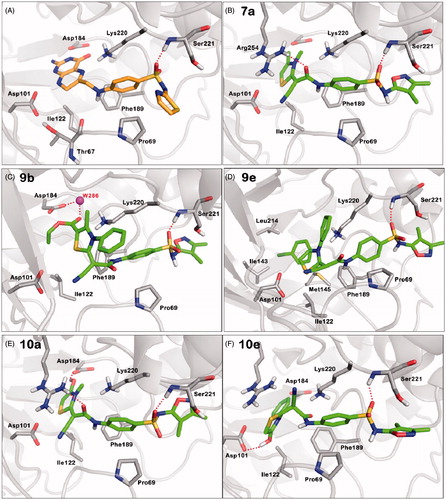
Figure 2. Predicted binding modes of the studied compounds generated by MOE-Dock. (A) Interactions with key residues in the crystal structure of the STZ-DHPP adduct (orange carbons) with BaDHPS (PDB code 3TYE, STZ: sulfathiazole, DHPP: 6-hydroxymethyl-7,8-dihydropterin-pyrophosphate). (B–F) Docking poses for compounds 7a, 9b, 9e, 10a and 10e, respectively (green: ligand's carbon, red: oxygen, blue: nitrogen, yellow: sulfur, white: hydrogen). Protein is shown as light gray cartoons, hydrogen bonds as dotted red lines, and crystal water W286 as magenta sphere. Colors are available in the online version of the paper.