Figures & data
Figure 1. Schematic representation of the Sepharose-4B-l-tyrosine-3-aminophenantrene hydrophobic gel. l-Tyrosine by using saturated l-tyrosine solution in the same buffer was coupled to Sepharose-4B-l-tyrosine activated with CNBr. The functional group of l-tyrosine (–NH2) was covalently bound with Sepharose 4B by means of an amide bond. After that, l-tyrosine was attached to the activated gel as a spacer arm, and finally diazotized 3-aminophenantrene was clamped to the meta position of l-tyrosine molecule as ligand. In this way, Sepharose-4B-l-tyrosine-3-aminophenantrene hydrophobic interaction gel was obtained. The hydrophobic interaction chromatography column was equilibrated with 0.1 M Na2HPO4 buffer pH 8.00 including 1 M (NH4)2SO4.
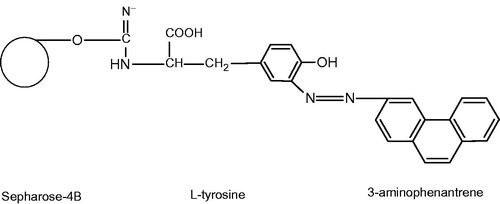
Figure 2. Elution graphic of PON1 with hydrophobic interaction chromatography. Purification of human serum PON1 by Sepharose 4B-l-tyrosine-3-aminophenantrene hydrophobic interaction chromatography with ammonium sulfate gradient. Fractions from the ammonium sulfate extraction were pooled as described in Methods section. This material was eluted by increasing the ammonium sulfate concentration. Protein concentration was determined by measuring an absorbance of 280 nm and PON1 activities of fractions were assayed activity using paraoxon substrate. 1 unit = 1 μmol min−1 per ml. U, units.
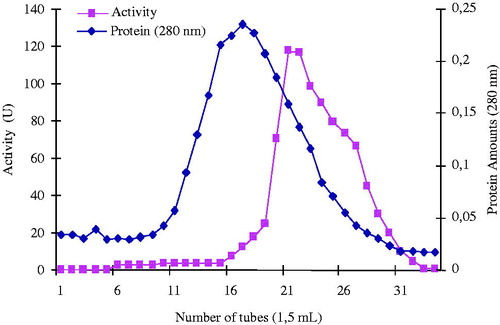
Table 1. Purification of human serum paraoxonase 1.
Figure 3. SDS-PAGE of human serum paraoxonase. The pooled fractions from ammonium sulfate precipitation and hydrophobic interaction chromatography were analyzed by SDS-PAGE (12 and 3%) and revealed by Coomassie Blue staining. Experimental conditions were as described in the method. Lane 2 contained 3 µg of various molecular mass standards: β-galactosidase (116,0), bovine serum albumin (66.0), ovalbumin (45.0), carbonic anhydrase, (33,0), ∞-lactoglobulin (25.0), lysozyme (19.5). Thirty microgram of purified hPON (lane 1) migrated with a mobility corresponding to an apparent Mr 43.0 kDa.
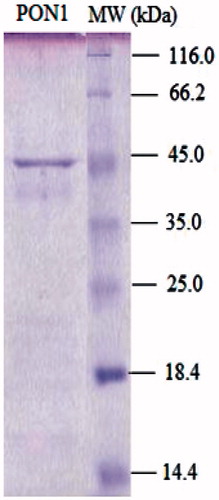
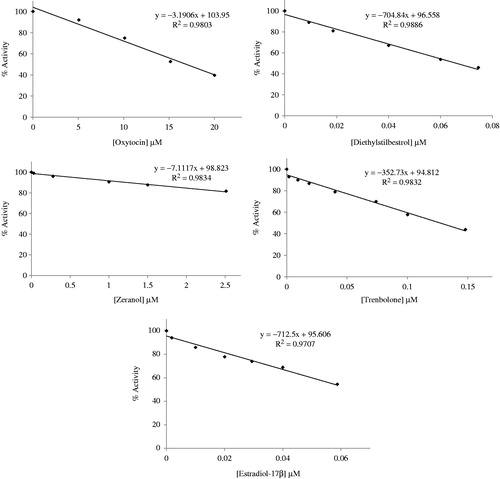
Figure 4. Inhibition graphics of anabolizan compounds.