Figures & data
Figure 1. Synthetic procedures for the synthesis of chalcones a1–a4, of diether c and of bis-chalcones ethers b1–b4.
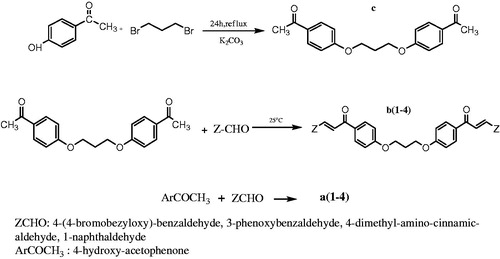
Figure 2. (A) 4-Hydroxy-substituted chalcones a (1–4). (B) Bis-chalcones etherified derivatives b (1–4).
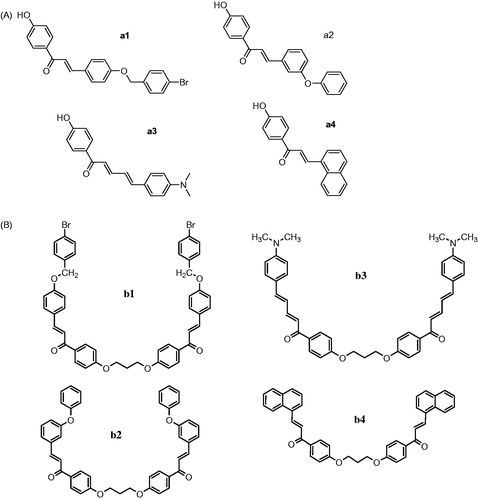
Table 1. Lipophilicity values: (i) theoretically calculated as clog P and (ii) experimentally determined as RM.
Table 2. Interaction–RA% with DPPH (RA%); % inhibition of lipid peroxidation (AAPH%); in vitro inhibition of soybean LOX (IC50 or %); in vitro inhibition of AChE (IC50 or %).
Table 3. Physicochemical properties calculated by the program Spartan v. 5.1.3.
Figure 3. Inhibition % of AChE induced by100 μM of compounds a3, b (2–4) in relation to the time (0–30 min).
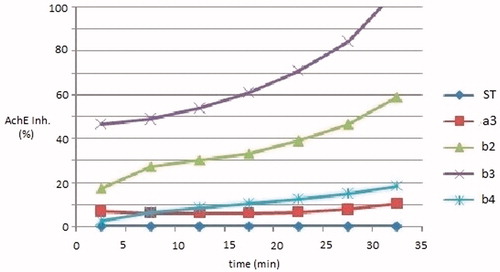
Table 4. Stability studies and incubation with GSH.
Figure 4. Cytotoxicity of chalcones (a1–a4) and Bis-chalcones–ethers (b1–b4) on L929 cells (24-h incubation) expressed as PI % values.
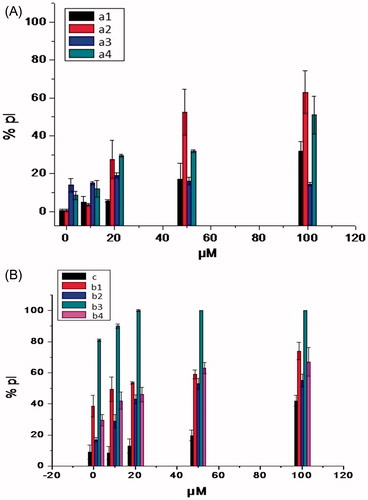
Figure 5. Histogram (left) and graphical visualization (right) of predicted (A) CYP1A1, (B) CYP1A2, (C) CYP2D6 metabolic sites for compound b2. Four different shades of color are used; from dark (lowest probability) to white (highest). The major metabolic site is highlighted (blue color).
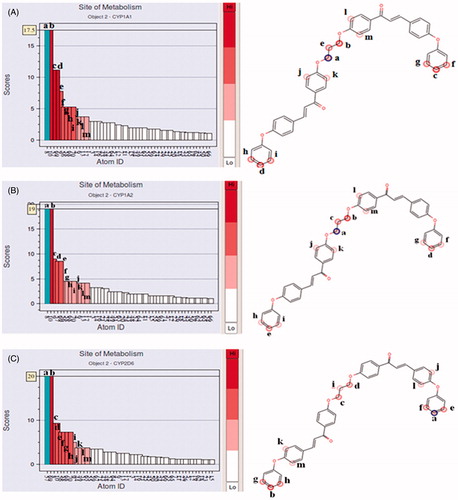
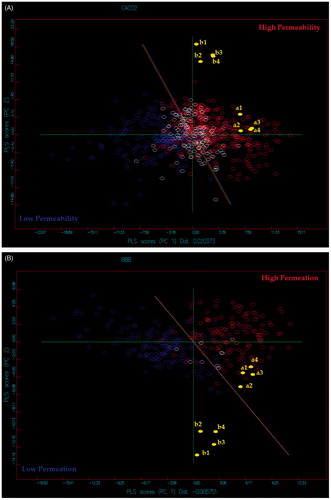
Figure 6. In silico: (A) Caco-2 permeability and (B) BBB permeation.