Figures & data
Figure 1. Activity (%) versus polyphenols concentrations regression analysis graphs for PKM2 in the presence of some polyphenols.
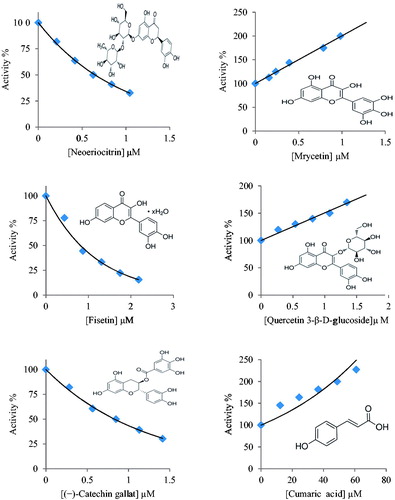
Figure 2. The Lineweaver–Burk graph using three different taxifolin concentrations for determination of Ki.
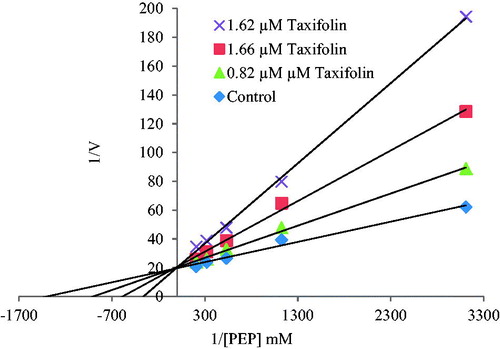
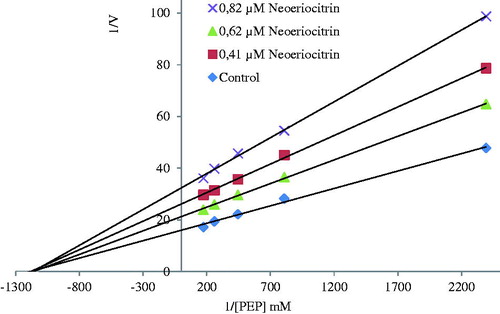
Figure 3. The Lineweaver–Burk graph using three different neoeriocitrin concentrations for determination of Ki.