Figures & data
Figure 1. Structure of tacrine, donepezil, rivastigmine and galanthamine.
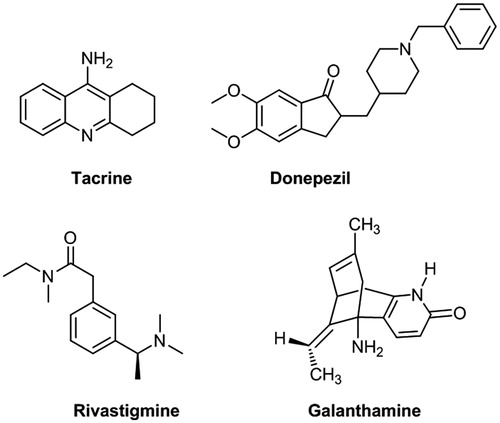
Figure 2. Chemical structures of ladostigil and rasagiline.
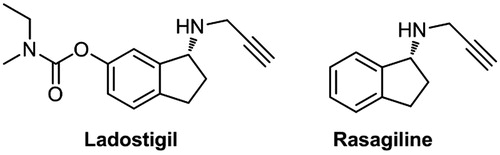
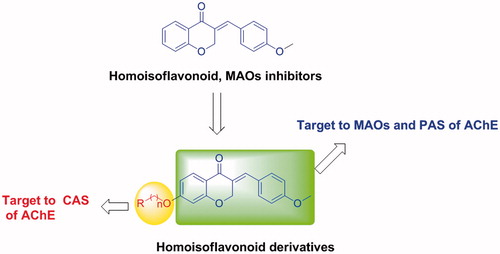
Figure 3. Design strategy for homoisoflavonoid derivatives.
Scheme 1. Reagents and conditions: (a) 3-chloropropionic acid trifluoromethanesulfonic acid; (b) NaOH, 0 °C; (c) p-methoxybenzaldehyde, piperidine, 80 °C; (d) α,ω-dibromo alkane, K2CO3, KI, butanone, rt; (e) amines, acetonitrile, reflux.
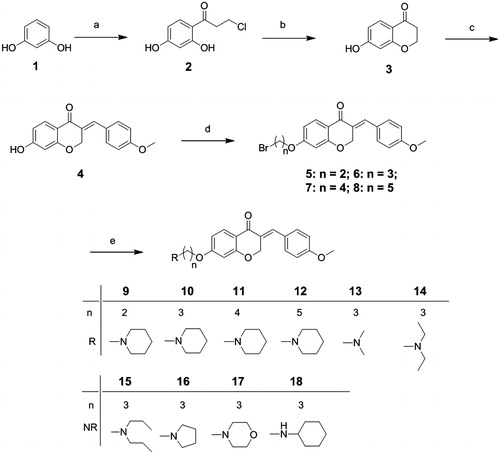
Table 1. In vitro inhibition IC50 (μM) and selectivity of compounds 4, 9–18 on ChEs and MAOs.
Figure 4. Steady state inhibition by compound 10 of AChE hydrolysis of ACh; the plots show mixed-type inhibition for compound 10 on AChE.
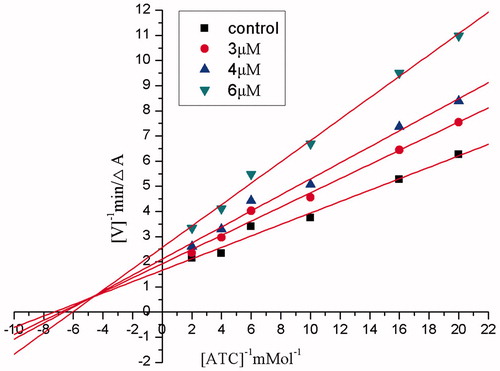
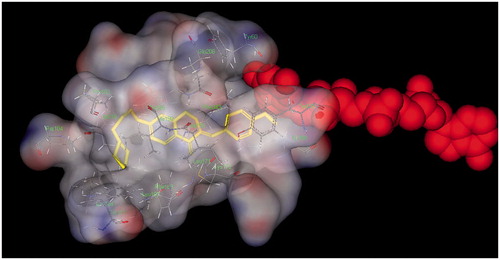
Figure 5. Docking models of the compound–enzyme complex. (a) stereoviews looking down the gorge of TcAChE binding with 10 (yellow). (b) 10 docked into the catalytic gorge of TcAChE, highlighting the protein residues belonging to ACS and PAS that establish the main interactions.
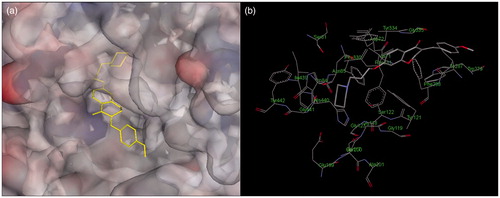
Table 2. Reversibility and irreversibility of hMAO-B inhibition of hybrid 10 and pargylinea.
Figure 6. Docking pose of derivative 10 (yellow) into human MAO-B (2V60) highlighting the protein residues that establish the main interactions with 10. The FAD cofactor was depicted using space fill representation.