Figures & data
Table 1. The inhibition profiles of taxifolin on purified hCA I and II from human erythrocytes by sepharose-4B-l-tyrosine-sulfanilamide affinity chromatography and inhibition of AChE purified from electric gel (Electrophorus electricus).
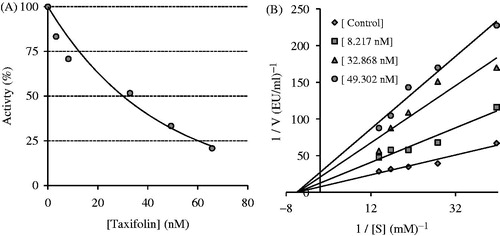
Figure 1. Determination of the half maximal inhibitory concentration (IC50) (A) and inhibition constant (Ki) values (B) of taxifolin for human erythrocyte carbonic anhydrase I isoenzyme (hCA I) by using a Lineweaver–Burk graph.
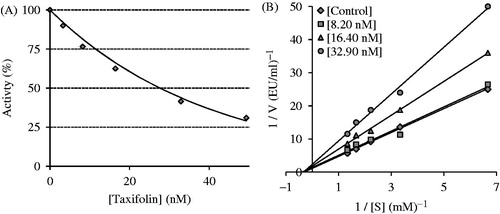
Figure 2. Determination of the half maximal inhibitory concentration (IC50) (A) and inhibition constant (Ki) values (B) of taxifolin for human erythrocyte carbonic anhydrase II isoenzyme (hCA II) by using a Lineweaver–Burk graph.
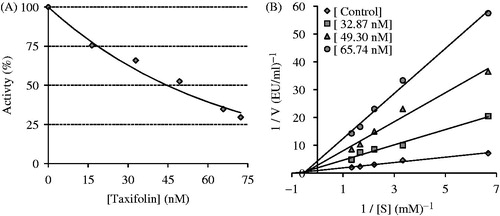
Figure 3. Determination of the half maximal inhibitory concentration (IC50) value (A) and inhibition constant (Ki) value (B) of taxifolin for acetylcholinesterase enzyme (AChE) by using a Lineweaver–Burk graph.