Figures & data
Figure 1. The structure of (E)-3,4-dihydroxystyryl aralkyl sulfones and sulfoxides.
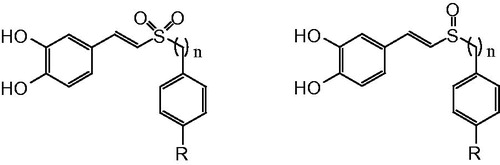
Table 1. Physical and analytical data for target compounds.
Scheme 1. Synthesis of (E)-3,4-diacetoxystyryl sulfone and sulfoxide derivatives.
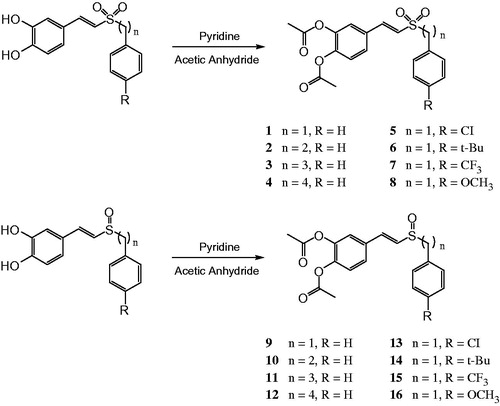
Figure 2. The structure of (E)-3,4-diacetoxystyryl sulfone and sulfoxide derivatives.
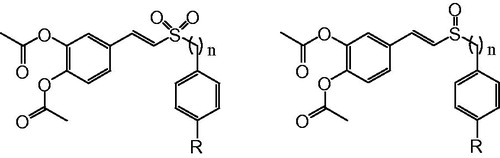
Figure 3. Protective effect of compound 7 on 6-OHDA-induced toxicity. PC12 cells in 6-well plates were pretreated by the tested compound for 3 h. Then cells were treated with 500 μM 6-OHDA for 12 h. Compare untreated control cultures (a) with those treated with 6-OHDA (b) and 6-OHDA plus compound 7 (10 μM; (c)) and (40 μM; (d)). Compound 7 significantly attenuated 6-OHDA-induced toxicity as revealed by the cell states.
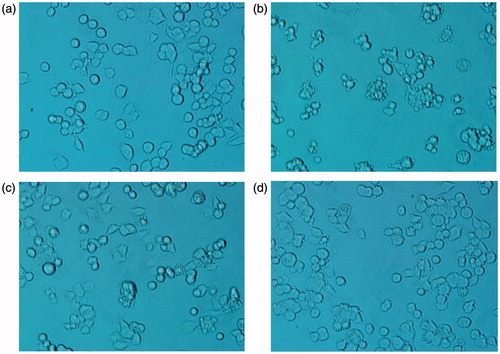
Table 2. Protective effect of 1–16 on 6-OHDA-induced toxicity of PC12 at 40 μM.
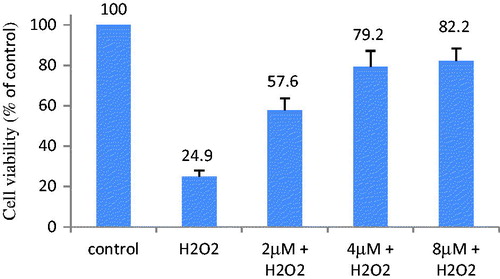
Figure 4. Compound 3 at 2, 4 and 8 μM inhibit H2O2-induced cell injury. PC12 cells in 96-well plates were pretreated by the tested compound for 3 h. Then the cells were treated with 500 μM H2O2 for 5 h. Cell viability was determined by the MTT assay. The viability of untreated cells as control is defined as 100%.