Figures & data
Table 1. Anthraquinone molecular structures and their log P (taken from PubChem).
Table 2. List of ligands showing their molecular weight and formula, hydrogen bond acceptors, hydrogen bond donors and torsions.
Figure 1. The hypermolecule comprising common features of the dataset.
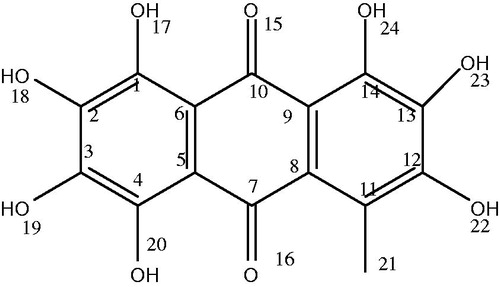
Figure 2. Glycogen synthase kinase-3 beta receptor, PDB Entry ID: 3Q3B, obtained from RCBS Protein data bank.
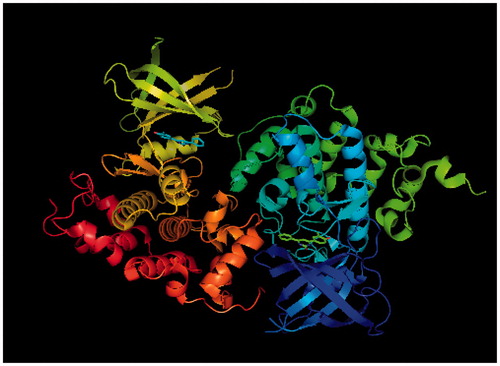
Figure 3. Binding energy (kcal/mol) for the docked ligands.
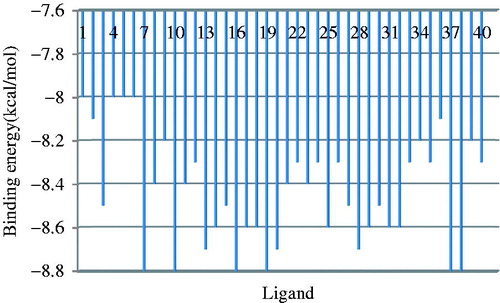
Table 3. Final lamarckian genetic algorithm docked state – binding energy for nine ligand conformations.
Figure 4. (a): Pharmacophore model for the receptor glycogen synthase kinase-3 beta. (b): Selected data on the pharmacophore model of anthraquinone/3Q3B protein interaction.
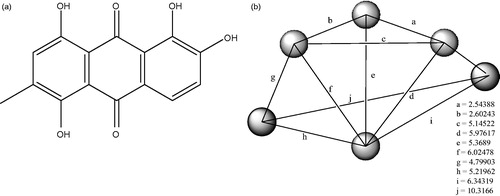
Table 4. LD50, sum descriptor and topological indices for the set of 40 anthraquinone derivatives.
Table 5. Topological indices computed for the anthraquinone in .
Table 6. The best models in describing log P in the training set of anthraquinone in .
Table 7. Leave-one-out analysis for best log P models in .
Figure 5. The plot log P versus log Pcalc. for the test set (mass fragments, external validation).
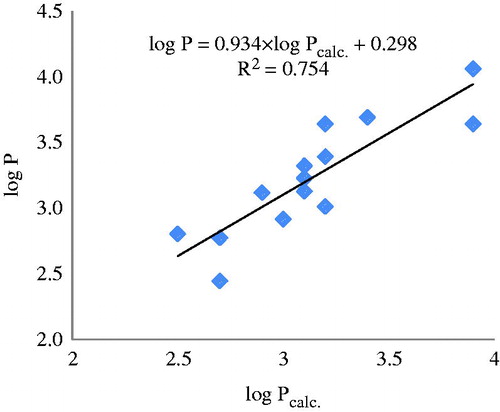
Table 8. Calculated values of log P for the molecules in the test set (mass fragments) .
Figure 6. The plot log P versus log Pcalc. by similarity clusters (mass fragments).
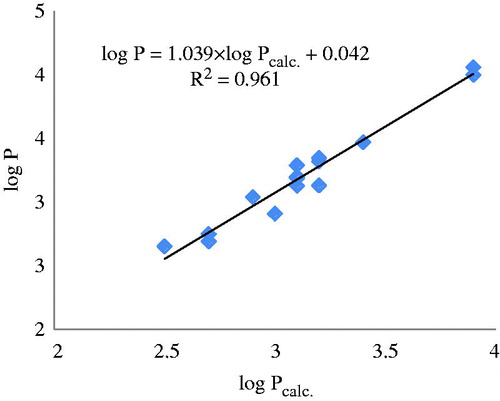
Table 9. Calculated values of log P by similarity clusters, for the molecules in the test set (mass fragments) ().
Table 10. The best models in describing LD50 in the training set of anthraquinone in .
Table 11. Leave-one-out analysis for best LD50 models in .
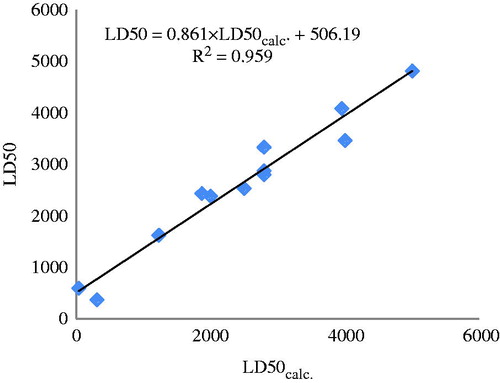
Figure 7. The plot LD50 versus LD50calc. for the test set (partial charges, external validation).
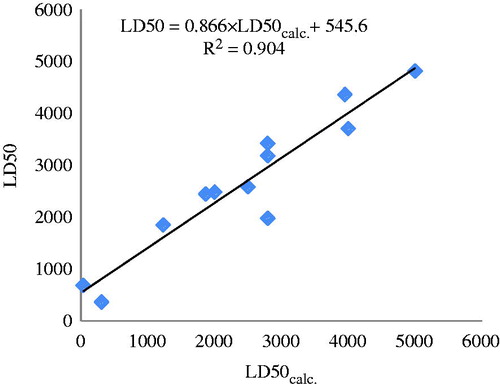
Table 12. Calculated values of LD50 for the molecules in the test set (partial charges).
Figure 8. The plot LD50 versus LD50calc. by similarity clusters (partial charges).