Figures & data
Scheme 1. Reagents and conditions: (a) benzaldehyde, NaOH, EtOH, rt; (b) Br(CH2)nBr, K2CO3, DMF, 80 °C; (c) secondary amine, K2CO3, NaI, acetone, reflux.
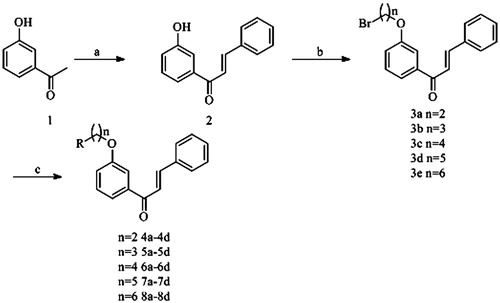
Table 1. Inhibition of AChE and BuChE (IC50 values and selectivity) and log P values of nitrogen-containing chalcone derivatives.
Figure 1. (A) Effects of alkyl chain lengths on anti-AChE activities; (B) effects of alkyl chain lengths on selectivity for AChE.
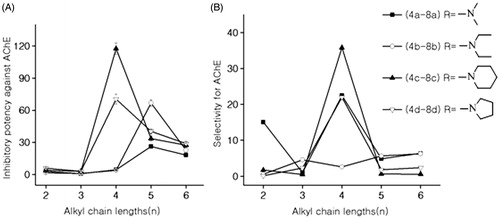
Figure 2. The comparison of the inhibitory activity between the corresponding Flavokawain B derivatives and chalcone derivatives against AChE.
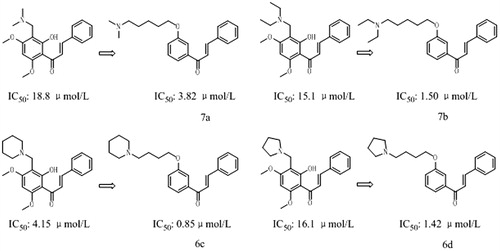
Figure A1. Some examples of the derivatives from natural products with structural simplification.
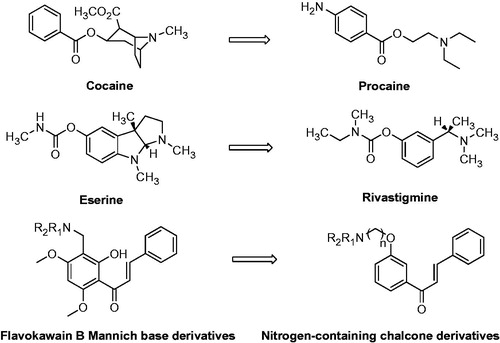
Figure A2. (A) Lineaweaver–Burk plot for the inhibition of AChE by compound 6c; (B) the replots of the intercept versus concentration of compound 6c; (C) the replots of the slope versus concentration of compound 6c.
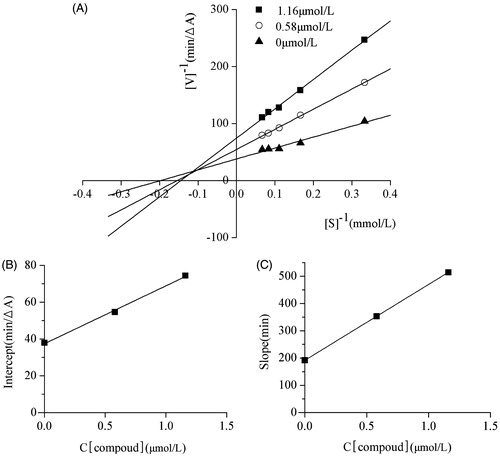
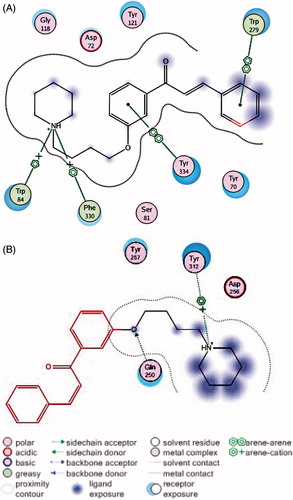
Figure A3. Molecular modelling of compound 6c with AChE (A) and BuChE (B) generated with MOE2008.