Figures & data
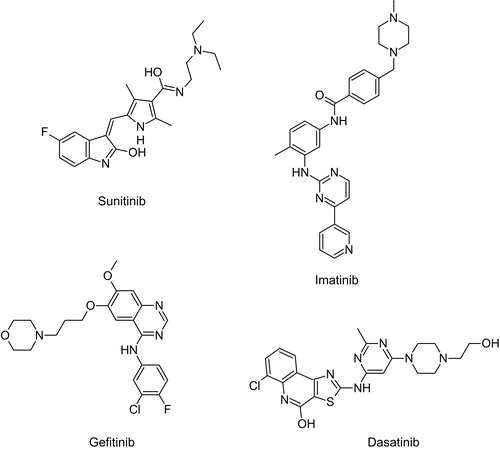
Scheme 1. Structures of sunitinib, imatinib, gefitinib and dasatinib.
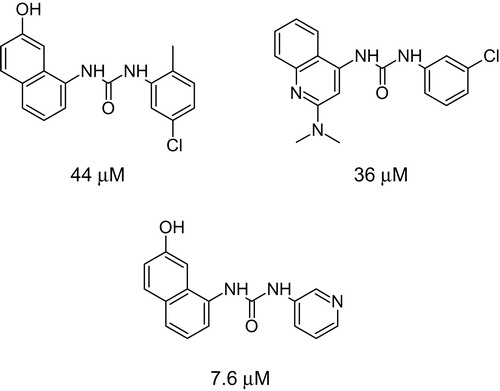
Scheme 2. Urea compounds active in CDK assay with their IC50 valuesCitation21.
Scheme 3. Synthesis of 1-substituted-3-{2-[(4-nitrophenyl)amino]ethyl}urea (5a–d), 1-substituted-3-{2-[(5-nitropyridin-2-yl)amino]ethyl}urea (6a–g), 2-imino-3-(4-nitrophenyl)-N-phenylimidazolidine-1-carboxamide (8) and 1-[1-(4-nitrophenyl)-4,5-dihydro-1H-imidazol-2-yl]-3-phenylurea (9). (i) NH2CH2CH2NH2, reflux. (ii) RNCO or RNHCOIm, room temperature. (iii) BrCN, MeOH, reflux. (iv) 1. NaOH 2.PhNCO, DCM.
![Scheme 3. Synthesis of 1-substituted-3-{2-[(4-nitrophenyl)amino]ethyl}urea (5a–d), 1-substituted-3-{2-[(5-nitropyridin-2-yl)amino]ethyl}urea (6a–g), 2-imino-3-(4-nitrophenyl)-N-phenylimidazolidine-1-carboxamide (8) and 1-[1-(4-nitrophenyl)-4,5-dihydro-1H-imidazol-2-yl]-3-phenylurea (9). (i) NH2CH2CH2NH2, reflux. (ii) RNCO or RNHCOIm, room temperature. (iii) BrCN, MeOH, reflux. (iv) 1. NaOH 2.PhNCO, DCM.](/cms/asset/97836b71-3100-4e2e-b567-1959fcbf6c8f/ienz_a_1057716_sch0003_c.jpg)
Figure 1. A view of the X-ray molecular structure of 9 with the atomic labelling scheme. Non H-atoms are represented by displacement ellipsoids of 30% probability.
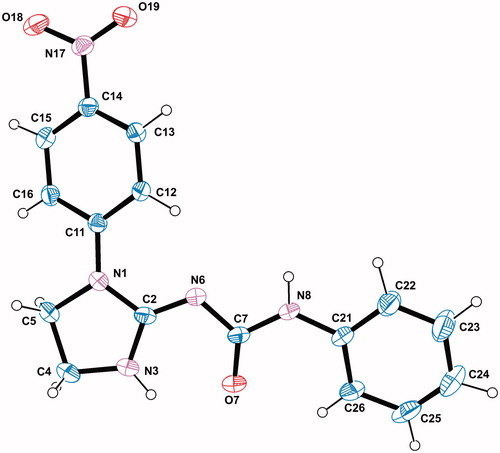
Table 1. Effects of the synthesized compounds on cancer and normal cells in vitro.
Table 2. Effect of the synthesized compounds on inhibition of protein kinases CDK2/cyclin E and c-Abl.
Figure 2. HOMO (A) and LUMO (B) orbitals for 9. (C) The map of the electrostatic potential onto a surface of the electron density for 9.
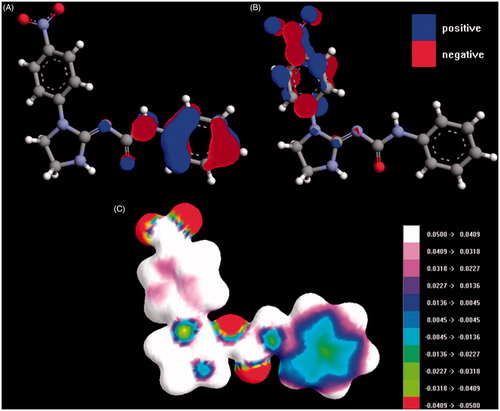
Table 3. Molecular descriptors of the investigated compounds.
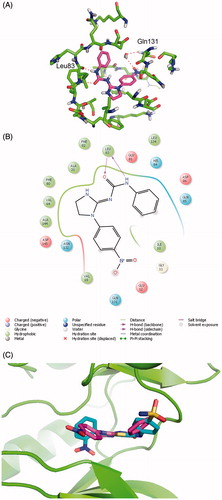
Figure 3. Compound 9 in stick representation with magenta carbon atoms in the binding pocket of CDK2 (protein colored with green carbon atoms) (A), 2D interaction map (B) and 9 superimposed to the reference ligand (stick representation, cyan carbon atoms, hydrogen atoms not shown in ligands for clarity; protein shown as green cartoon) (C). Hydrogen bonds shown as red dashed lines (color version available online).