Figures & data
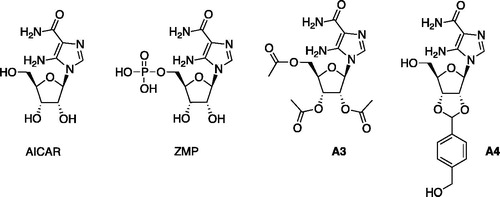
Figure 1. Structures of AICAR and ZMP and derivatives A3 and A4.
Scheme 1. Reagents and conditions: (i) DNCB, K2CO3, DMF, 80°C, 3 h; (ii) EDA, DMF, 50°C, 8 h; (iii) TFA (2% in dry DCM), r.t., 8 min.
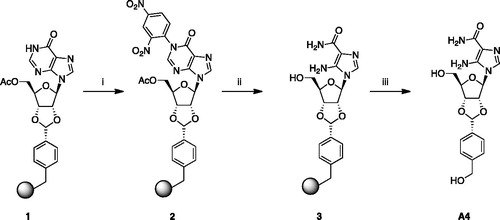
Figure 2. Graphical representation of pixel quantization of p-AMPK in A549, HepG2 and C2C12 cells and one representative WB image of p-AMPK, p-ACC and GAPDH. For other details see materials and methods. WB, western blot. Asterisks indicate statistical differences between control and treatments p < 0.05. CN: untreated cells.
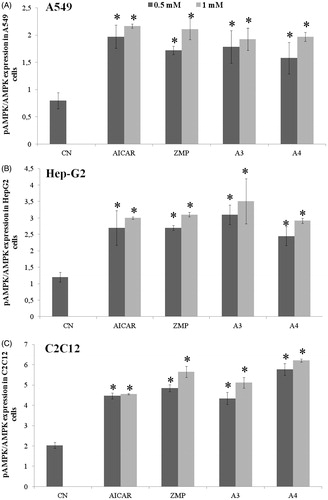
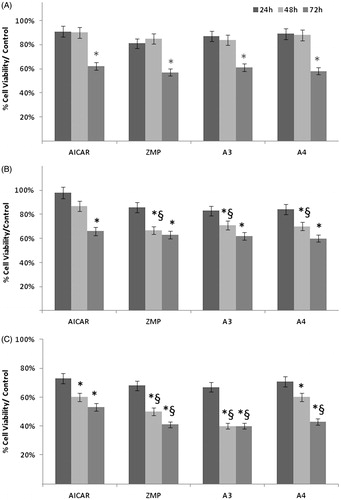
Figure 3. Cytotoxicity of AICAR, ZMP and A3 and A4 derivatives on A549, HepG2 and C2C12 cell lines. (A) A549, (B) HepG2, (C) C2C12 cells were treated with 1.0 mM AICAR, ZMP, A3 and A4 for 24, 48 and 72 h and viability assessed by MTT assay. Values represent means ± SE of experiments performed two times in triplicate. Statistical differences between untreated cells (control) and treated cells are indicated by * and among cells treated with AICAR and derivatives by §. p < 0.05.