Figures & data
Figure 1. Chemical structures of isolated flavonoids (1–3) from the root bark of C. hirtella and parent compounds (dalbergioidin) of 3.
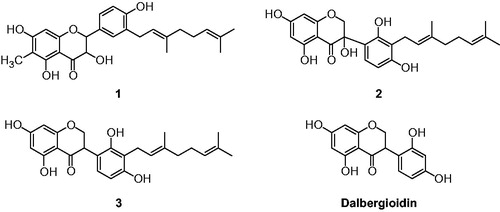
Figure 2. (A) Effect of compounds on the HNE-catalyzed hydrolysis of methoxysuccinyl-Ala-Ala-Pro-Val-p-nitroanilide (compound 1, •; compound 2, ▾; compound 3, ○; dalbergioidin, △, respectively.) (B–D) Lineweaver–Burk plot for inhibition of the HNE-catalyzed hydrolysis of substrate by compounds (1–3).
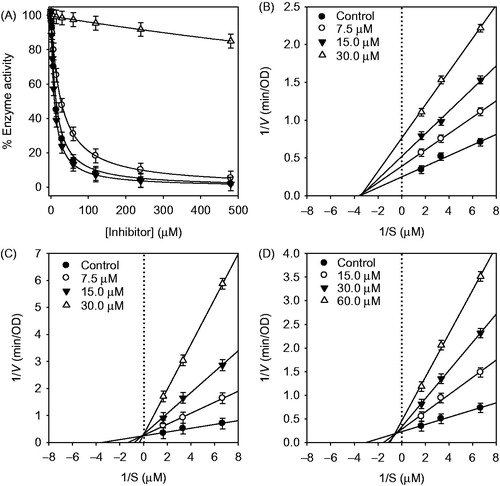
Table 1. Inhibitory effect of isolated compounds 1–8 on human leukocyte elastase.
Table 2. Peak assignments, mass spectral data, and cited references of flavonoids in the root bark of C. hirtella from the positive and negative mode using HPLC-DAD-ESI/MS.
Figure 3. (A) Typical HPLC-DAD chromatogram of the methanol extracts of C. hirtella detected at 280 nm. (B) Mass fragmentation patterns of identified peaks that accord with compound number. (a) compound 1; (b) compound 2; (c) compound 3; (d) compound 4; (e) compound 5; (f) compound 6; (g) compound 7; (h) compound 8.
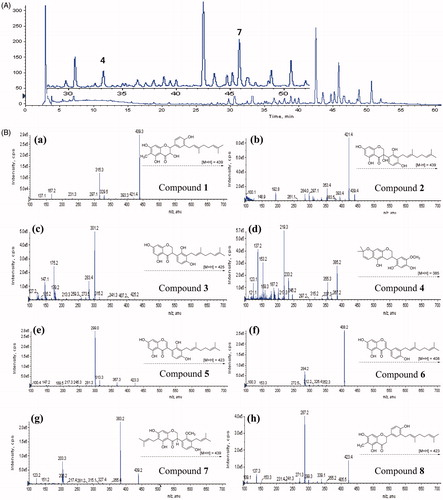
Figure 4. Inhibition of HNE by compound 2. (A) The hydrolytic activity of HNE as function of enzyme concentration at different concentrations of compound 2. (B) Time-dependent inhibition of HNE in the presence of compound 2 with varying pre-incubation times. (C) Pre-incubation time dependence of the fractional velocity of the enzyme-catalyzed reaction in the presence of varying concentration of compound 2. (D) Dependence of kobs on the concentration of compound 2. The kobs values determined in (C) were fitted to Equation (3).
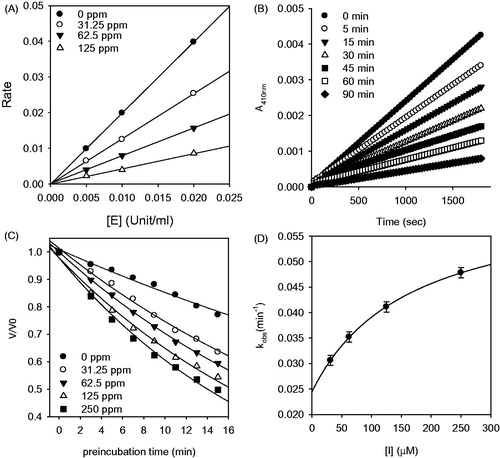
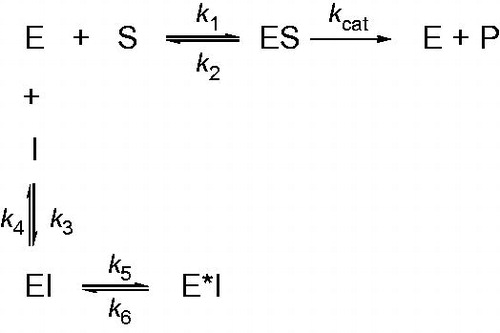
Figure 5. Scheme for time-dependent enzyme inhibition. The upper part (k1, k2, kcat) denotes turnover of the enzyme in the absence of inhibition and were calculated using traditional methods as delineated in Materials and methods section. The lower part illustrates the mechanism for a slow-binding inhibition. In simple reversible slow-binding inhibition process of the values of k3 and k4 are slow relative to enzyme turnover and k5/k6 does not occur. In enzyme isomerization, an initial binding of the inhibitor to the enzyme leads to formation of the EI complex, which undergoes an isomerization to form the new complex E*I.