Figures & data
Figure 1. Chemical structures of acetic acid compounds.
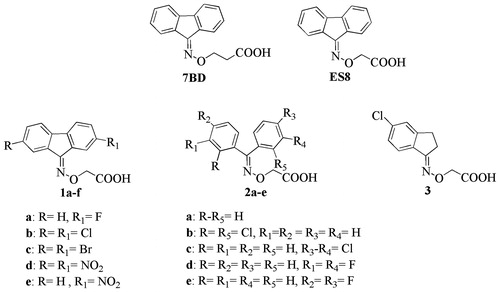
Figure 2. Electron density and binding modes for acetic acid compounds 1b, 1c and 2c. (A) Ligand 1c and its electron density represented as a multi-wire mesh to highlight the electron dense bromine atoms is shown in the context of the tetramer formed by TTR molecule A (left) and B (bottom) and their symmetry related molecules (top). (B) The bromine atoms occupy two of the halogen-specific binding sites with the carboxylate oxygens (O1 and O2) making polar contacts with Ser117 (O2—OG = 2.9 Å; O2—O = 3.1 Å) and Thr119 (O1—OG = 2.4 Å; O2—OG = 2.9 Å). Lys15, shown in the background, does not participate in binding to the carboxylate, characterizing the ligand as reverse mode binder. (C) Ligand 1b also binds to a single site in good electron density. (D) The binding mode is similar but not identical to that of 1c, the differences being characterized by longer H-bond distances with Ser117 (O1—OG = 3.1 Å; O2—O = 3.1 Å) and a single interaction with Thr119 (O1—OG = 2.8 Å). (E) There is good electron density for ligand 2c in both TTR binding sites. The carboxylate points towards Lys15 defining the ligand as a forward mode binder. (F) The salt bridge distances are: O1—NZ = 2.7 Å and O2—NZ = 3.2 Å.
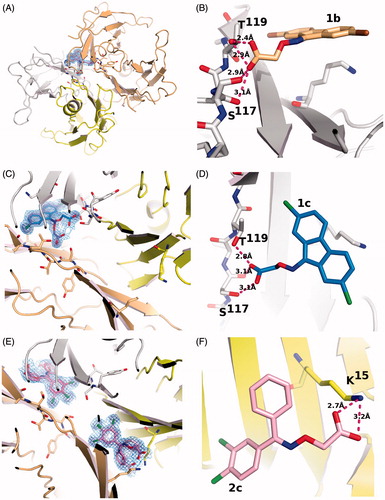
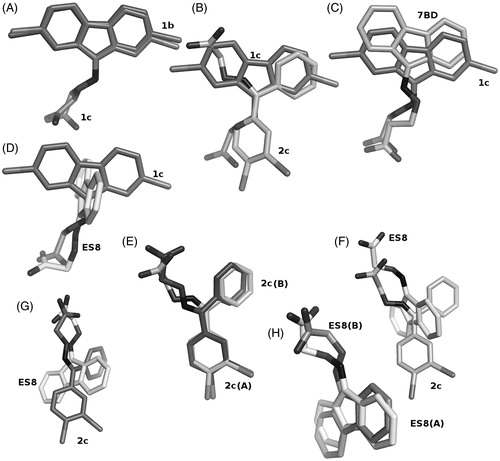
Figure 3. Comparison of ligand binding in the forward and reverse mode. (A) Ligands 1b and 1c show only minor differences in their positioning in the TTR binding site. The differences in radii between the two halides is responsible for the changes. (B) Ligands 1c and 2c show differences in the binding mode, in the halogen pocket that is used for their binding but occupy the same overall volume, when the superposition with its symmetry related molecule is considered. (C) The binding of ligand 1c is better compared to ligand 7BDCitation23, shown in salmon sticks, that to ligands ES8Citation23 shown in panel (D) Since the addition of the halogen atoms precludes a perpendicular binding mode similar to ES8, it must adopt a reverse mode binding similar to 7BD but shifted due to the presence of the halogen atoms. (E) Ligand 2c binds to both TTR binding sites with only minor differences. (F and G) These minor binding differences appear amplified when 2c is compared to ES8 in the two sites. (H) The superimposed ES8 binding to TTR show the same qualitative variation observed for 2c and for 1b relative to 1c where the carboxylate changes its orientation.
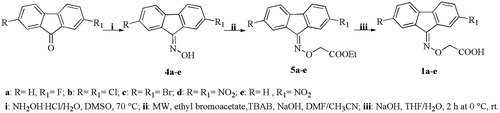
Scheme 1. Synthesis of fluorenyl derivatives 1a–e.
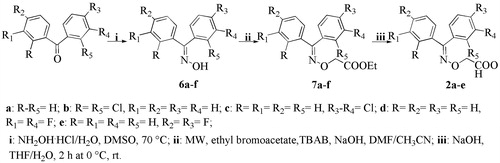
Scheme 2. Synthesis of benzophenone compounds 2a–e.
Scheme 3. Synthesis of indanone derivatives 3.
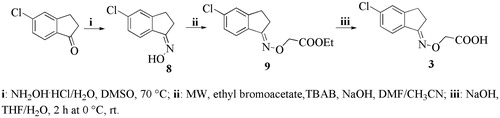
Table 1. Statistics for data collection, processing and refinement on TTR-ligand complexes.
Table 2. In vitro acid-mediated wt-TTR (7.2 μM) percentage of fibril formation for compounds 1a–e, 2a–f and 3.
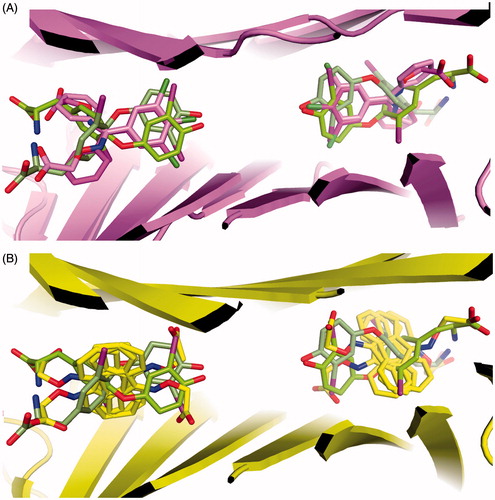
Figure 4. Crystal packing and ligand binding. (A) Crystal packing of TTR monomer A with inhibitor 1b bound and, (B) packing of monomer B without a ligand. The asymmetric unit of the P21212 lattice comprises a dimer A–B that forms a tetramer with A–B′ via a crystallographic symmetry operation. Differences in crystal packing distinguish the two monomers, A and B, where monomers A and A′ pack tighter that B–B′. By convention, ligands bind to monomer A while the empty site is assigned to monomer B. The RMSD deviations on Cα between two chains involved in ligand binding; between chains both not involved in ligand binding and between chains with ligand compared to chains without ligand to show the divergence that exists between monomers involved and not involved in ligand binding. (C) The binding of 1b appears to induce a small conformational change in order to better accommodate the bromine atom in the halogen pocket of molecule A. (D) Molecule B (has been changed from green to yellow after superimposition on molecule A) shows that in order for the same ligand to bind to molecule B, similar conformational changes would need to be induced. (E) Without a change, that would facilitate binding to molecule B, positive cooperativity can be excluded. The evidence for conformational changes that would hinder ligand binding at site B are also lacking, since the dimer interface is essentially the same for the two molecules. (F) The differences observed in the loop 94–104 between molecule B and A are common to most TTR-inhibitor complexes, as shown here for ligand 2c.
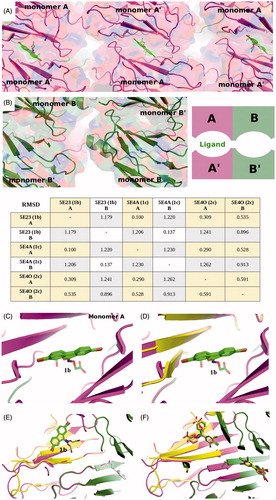
Figure 5. Superimposition of 2c and ES8 on 3,3′-diiodo-l-thyronine. (A) The halogen binding site exploited by 2b matches with that used by 3,3′-diiodo-l-thyronine. (B) The second halogen binding site used by 3,3′-diiodo-l-thyronine at right angles to the first one superimposes on the fluorenyl ring of ES8.