Figures & data
Figure 1. (A) The effects of ischemia/reperfusion (I/R) and treatment with Naringin on the MDA levels. *Between the I/R and control, I/R + NAR, p < 0.01. (B) The effects of ischemia/reperfusion (I/R) and treatment with Naringin on the GSH-Px levels. *Between the I/R and control, I/R + NAR, p < 0.05. (C) The effects of ischemia/reperfusion (I/R) and treatment with Naringin on the SOD levels. *Between the control and I/R and I/R + NAR, p < 0.01, **Between the I/R and I/R + NAR, p < 0.01. (D) The effects of ischemia/reperfusion (I/R) and treatment with Naringin eon the CAT levels. *Between the control and I/R, I/R + NAR, p < 0.05, **Between the I/R and I/R + NAR, p < 0.05.
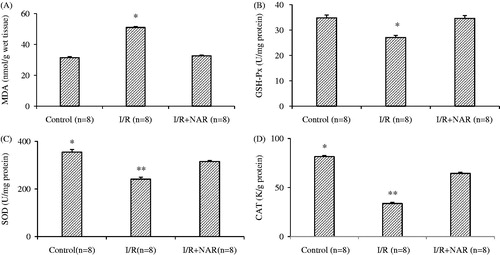
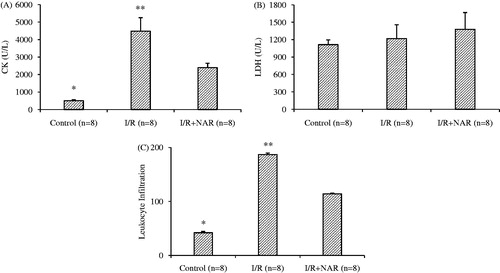
Figure 2. (A) Creatine kinase levels. *Between the control and I/R, I/R + NAR, p < 0.01, **Between the I/R and I/R + NAR, p < 0.05. (B) Lactate dehydrogenase (LDH) as indicators of muscle damage in blood levels of all groups. (C) Leukocyte infiltration of the all groups (the average leukocyte counts/0.25 mm2). *Between the control and I/R, p < 0.05, **Between the I/R and I/R + NAR, p < 0.05.