Figures & data
Table I. Study subjects – patient demographics and clinical characteristics.
Table II. Results of Microarray Analysis.
Table III. Gene ontology analysis.
Table IV. Results of qRT-PCR: 32 genes with differential expression between ripe versus unripe cervix in patients at term not in labor.
Figure 1. Results of qRT-PCR assay of versican in cervical tissue in patients at term without labor: unripe cervix versus ripe cervix.
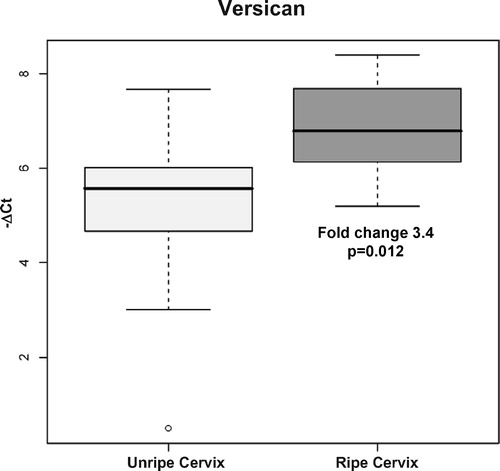
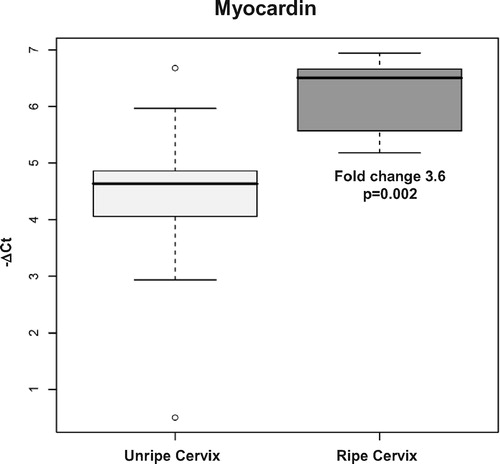
Figure 2. Results of qRT-PCR assay of myocardin in cervical tissue in patients at term without labor: unripe cervix versus ripe cervix.