Figures & data
Table I. Demographic and clinical characteristics of the study population (first study).
Table II. Demographic and clinical characteristics of the study population (second study).
Table III. Microorganisms isolated from the amniotic fluid in the first and second study.
Figure 1. Supervised analysis for classification of patients according to their metabolic profile of amniotic fluid. In green, patients who presented with PTL but delivered at term; in blue, those with PTL who delivered preterm without IAI and in red, those with IAI (PTL, preterm labor; IAI, intraamniotic infection/inflammation).
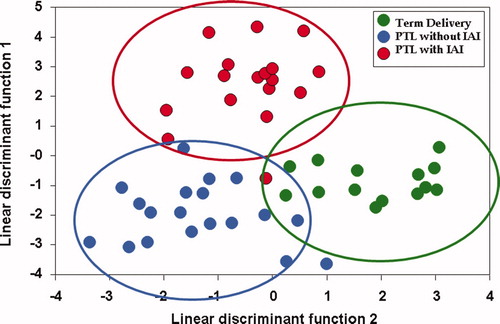
Table IV. Prediction of the clinical class according to the amniotic fluid metabolic profile (first study; supervised).
Figure 2. Each horizontal line is a fingerprint of the metabolomic profile of amniotic fluid in an individual patient. Each vertical line represents the concentration of a metabolite in amniotic fluid. The color scale provides an index of abundance. Three patient groups are included in the study (see left column), and the metabolic fingerprinting characterizing each group is within a colored box (IAI, intraamniotic infection/inflammation).
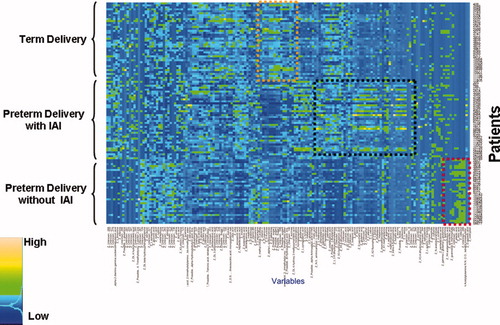
Table V. Differentially regulated metabolites in patients with PTL who delivered at term (second study).
Table VI. Differentially regulated metabolites in patients with PTL without IAI who delivered preterm (second study).
Table VII. Differentially regulated metabolites in patients with PTL with IAI (second study).
Table VIII. Prediction of the clinical class according to the amniotic fluid metabolic profile (second study).
Table IX. Metabolites important in classification determined by Random Forest (Gini index).
Table X. Relative abundance of carbohydrate and amino acids in the study groups.