Figures & data
Table I. Parameters explored in MDR analyses.
Table II. Demographic and clinical characteristics of the study population.
Table III. Gene summary information with the strongest associations (p < 0.01).
Table IV. Single-locus tests of association (p < 0.01) adjusted for fetal sex and BMI.
Table V. Single-locus tests of association (p < 0.05) adjusted for fetal sex and BMI.
Table VI. Haplotype sliding windows association results unadjusted for covariates (p < 0.05).
Figure 1. Haploview plots of genes identified in analyses of haplotype tests of association in maternal samples. LD plots were generated in Haploview and are presented for: (A) MMP9 controls r2; (B) MMP9 cases r2; (C) COL1A1 controls r2; (D) COL1A1 cases r2; (E) IL6R controls r2; (F) IL6R cases r2; (G) FGF4 controls r2; (H) FGF4 cases r2; (I) CRHR2 r2 controls; (J) CRHR2 cases r2; (K) ELN r2 controls; (L) ELN r2 cases. Within each triangle is presented the pair-wise correlation coefficient (r2) LD plots white (r2 = 0.01 shades of grey (0 < r2 < 11 black (r2 = 1).
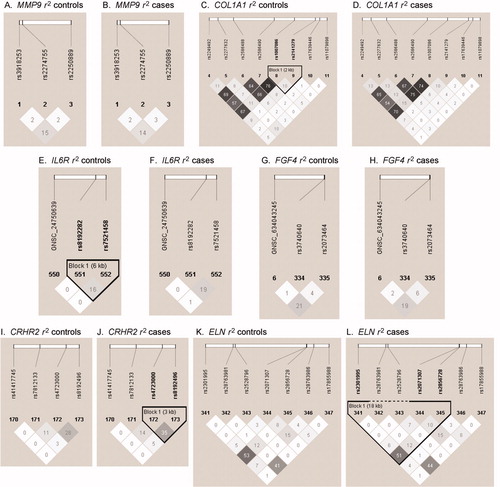
Figure 2. Haploview plots of genes identified in analyses of haplotype tests of association in fetal samples. LD plots were generated in Haploview and are presented for: (A) FN1 controls r2; (B) FN1 cases r2. Within each triangle is presented the pair-wise correlation coefficient (r2) LD plots whit1 (r2 = 01 shades of gre1 (0 < r2 <11 blac1 (r2 = 1).
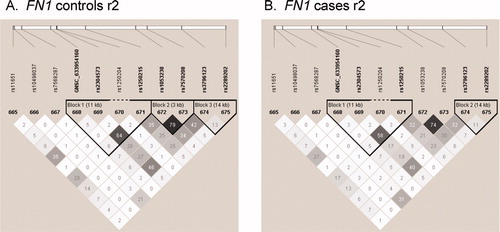
Table VII. Summary of MDR analyses.
Figure 3. MDR schematic for 2-way interaction involving maternal SNPs GNSC_635148713 in collagen type V α2 (COL5A2) and rs2227562 in plasminogen activator urokinase (PLAU). Dark gray boxes represent high-risk genotypes and light gray boxes represent low-risk genotypes. The left hand bar in each box is the number of SGA cases with that genotype and the right bar is the number of controls with that genotypes.
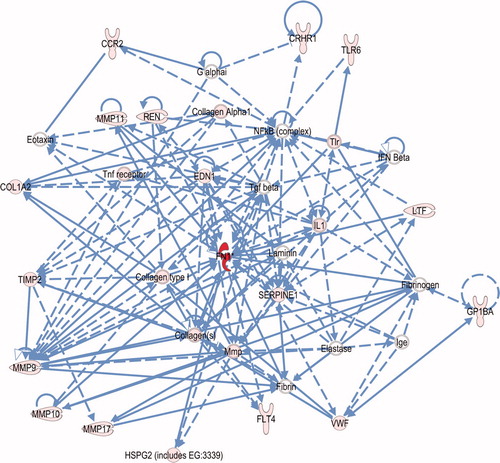
Figure 4. Connection map for first ranked maternal network generated by IPA from focus gene input. The biomarkers passing the p < 0.05 significance threshold (focus molecules) were entered in to the IPA software for an unsupervised functional analysis to discern regulatory networks involving these molecules. Focus molecules are depicted in pink and the most statistically-significant molecule is in red. The asterisk indicates that there was more than one SNP probe for the gene tested and the most significant value was placed into the analysis. Solid lines show direct interaction (binding/physical contact); dashed line indirect interaction supported by the literature but possibly involving one or more intermediate molecules that have not been investigated definitively. Molecular interactions involving only binding are connected with a line without an arrowhead since directionality cannot be inferred.
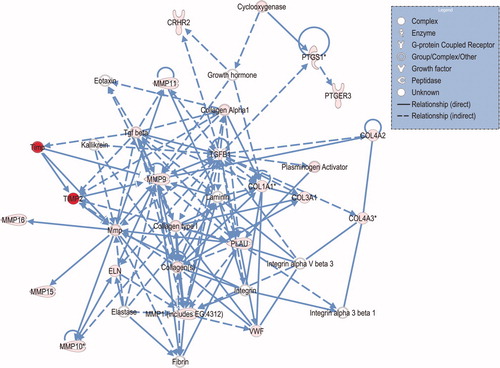
Figure 5. Connection map for first ranked fetal network generated by IPA from focus gene input. The biomarkers passing the p < 0.05 significance threshold (focus molecules) were entered in to the IPA software for an unsupervised functional analysis to discern regulatory networks involving these molecules. Focus molecules are depicted in pink and the most statistically-significant molecule is in red. The asterisk indicates that there was more than one SNP probe for the gene tested and the most significant value was placed into the analysis. Solid lines show direct interaction (binding/physical contact); dashed line indirect interaction supported by the literature but possibly involving one or more intermediate molecules that have not been investigated definitively. Molecular interactions involving only binding are connected with a line without an arrowhead since directionality cannot be inferred.