
Figures & data
Table 1. Demographic/clinical characteristics, maternal morbidity and adverse neonatal outcome by study groups.
Figure 1. Median maternal plasma Multiple of Median (MoM) concentrations of soluble vacular endothelial growth factor receptor (sVEGFR)-1, soluble endoglin (sEng), sVEGFR-2, placental growth factor (PlGF), PlGF/sVEGFR-1 ratio and PlGF/sEng ratio in patients who subsequently developed severe PE requiring preterm delivery and those who remained stable until term [sVEGFR-1: median 4.46 MoM, interquartile range (IQR) 2.5–9.8 MoM vs. 1.5 MoM, IQR 0.9–2.4 MoM; p < 0.001; sEng: median 3.3 MoM, IQR 2.1–5.6 MoM vs. 1.2 MoM, IQR 0.9–1.7 MoM; p < 0.001; sVEGFR-2: median 0.69 MoM, IQR 0.5–0.9 MoM vs. 0.9 MoM, IQR 0.7–1.1 MoM; p < 0.001; PlGF: median 0.15 MoM, IQR 0.08–0.23 MoM vs. 0.47 MoM, IQR 0.3–1.1 MoM; p < 0.001; PlGF/sVEGFR-1: median 0.03 MoM, IQR 0.008–0.07 MoM vs. 0.4 MoM, IQR 0.2-0.9 MoM; p < 0.001; PlGF/sEng: median 0.04 MoM, IQR 0.01–0.09 MoM vs. 0.4 MoM, IQR 0.2–0.9 MoM; p < 0.001].
![Figure 1. Median maternal plasma Multiple of Median (MoM) concentrations of soluble vacular endothelial growth factor receptor (sVEGFR)-1, soluble endoglin (sEng), sVEGFR-2, placental growth factor (PlGF), PlGF/sVEGFR-1 ratio and PlGF/sEng ratio in patients who subsequently developed severe PE requiring preterm delivery and those who remained stable until term [sVEGFR-1: median 4.46 MoM, interquartile range (IQR) 2.5–9.8 MoM vs. 1.5 MoM, IQR 0.9–2.4 MoM; p < 0.001; sEng: median 3.3 MoM, IQR 2.1–5.6 MoM vs. 1.2 MoM, IQR 0.9–1.7 MoM; p < 0.001; sVEGFR-2: median 0.69 MoM, IQR 0.5–0.9 MoM vs. 0.9 MoM, IQR 0.7–1.1 MoM; p < 0.001; PlGF: median 0.15 MoM, IQR 0.08–0.23 MoM vs. 0.47 MoM, IQR 0.3–1.1 MoM; p < 0.001; PlGF/sVEGFR-1: median 0.03 MoM, IQR 0.008–0.07 MoM vs. 0.4 MoM, IQR 0.2-0.9 MoM; p < 0.001; PlGF/sEng: median 0.04 MoM, IQR 0.01–0.09 MoM vs. 0.4 MoM, IQR 0.2–0.9 MoM; p < 0.001].](/cms/asset/cdc14140-34ab-4fed-8387-5fc8ee5f6441/ijmf_a_806905_f0001_b.jpg)
Table 2. Diagnostic performance of plasma concentrations of angiogenic/anti-angiogenic factors for the identification of patients who subsequently developed severe preeclampsia requiring preterm delivery.
Figure 2. Area under the Receiver-Operating Characteristic (ROC) curves for angiogenic/anti-angiogenic factor ratio Multiples of the Median (MoM) compared to mean arterial pressure and combined standard tests (mean arterial pressure, serum creatinine, serum uric acid, aspartate aminotransferase, platelet count) for the identification of patients who delivered within 2 weeks (A) Restricted to patients who presented before 34 weeks of gestation; and (B) Included all patients in the cohort.
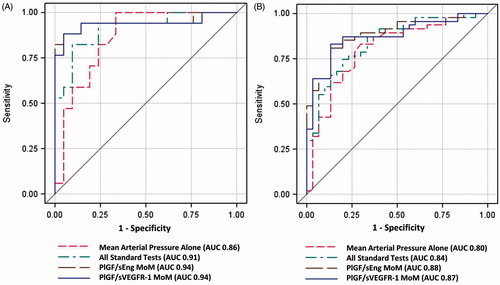
Table 3. Likelihood (unadjusted and adjusted) of each outcome according to angiogenic/antiangiogenic factors ratio.
Table 4. Demographic/clinical characteristics and adverse maternal and neonatal outcomes of the patients who presented to the triage area at <34 weeks according to interval to delivery within and more than 2 weeks.
Table 5. Diagnostic performance of plasma concentrations of angiogenic/anti-angiogenic factors among patients who presented at <34 weeks of gestation for the identification of patients who subsequently delivered within 2 weeks.
Table 6. Likelihood (unadjusted and adjusted) of selected pregnancy outcomes according to angiogenic/antiangiogenic factor ratio in patients who presented to the triage area at <34 weeks of gestation.
Figure 3. Addition of the PlGF/sVEGFR-1 ratio to standard tests significantly improved the sensitivity at a fixed false-positive rate of 3% (p = 0.004) and marginally improved sensitivity at a fixed false-positive rate of 5% (p = 0.06) for the identification of patients who would be delivered due to preeclampsia within 2 weeks.
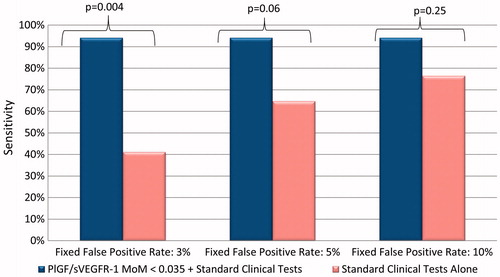
Table 7. Sensitivities of each outcome according to angiogenic/antiangiogenic factors ratio in patients who presented to the triage area at <34 weeks of gestation while fixing different false positive rates (FP).
Figure 4. Kaplan–Meier survival curves by angiogenic/anti-angiogenic ratio Multiple of Median (MoM) cut-offs of patients who delivered prior to 37 weeks of gestation (right censored). Patients who delivered preterm due to causes other than PE had the interval between blood draw and delivery treated as a censored observation. (A = PlGF/sVEGFR-1; B = PlGF/sEng).
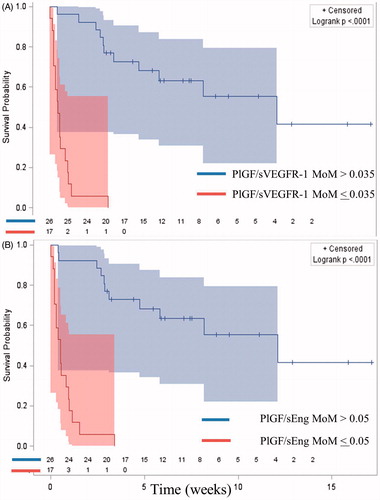
Table 8. Disposition of the patient after visiting the triage area (hospitalization versus discharge home), rate of preterm delivery and adverse perinatal outcomes according to the previously proposed grading of severity criteria based on plasma MoM concentrations of the PlGF/sVEGFR-1 ratio and the PlGF/sEng ratio.