Figures & data
Table 1. Comparison of assay characteristics between ELISA and lateral flow-based immunoassay point of care test (POC).
Table 2. Characteristics of study populations.
Figure 1. Bland–Altman plot: direct comparison between enzyme-linked immunosorbent assay (ELISA) and lateral flow-based immunoassay point of care (POC) amniotic fluid (AF) interleukin-6 (IL-6) techniques. AF IL-6 concentrations from three patients with preterm labor with microbial invasion of the amniotic cavity (MIAC) were excluded. SD, standard deviation.
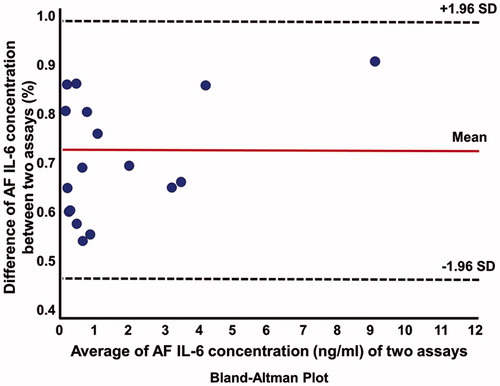
Figure 2. Amniotic fluid (AF) concentrations of interleukin-6 (IL-6) determined by enzyme-linked immunosorbent assay (ELISA) (square) and a lateral flow-based immunoassay point of care (POC) test (circle) of patients with preterm labor. Lateral flow-based immunoassay POC AF IL-6 concentrations were significantly lower than those of ELISA in every pair samples.
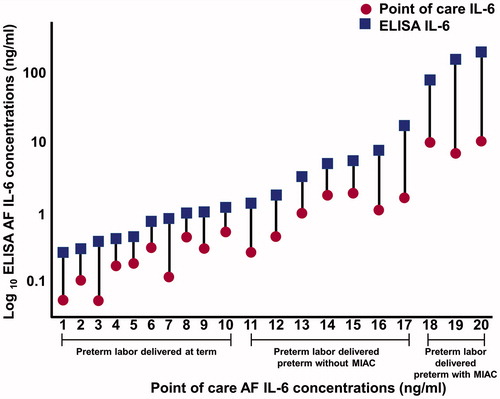
Figure 3. Amniotic fluid (AF) interleukin-6 (IL-6) scatter diagram with linear regression line (red line). Dashed line indicates 95% confidence interval. AF IL-6 concentrations from three patients with preterm labor with microbial invasion of the amniotic cavity (MIAC) were excluded.
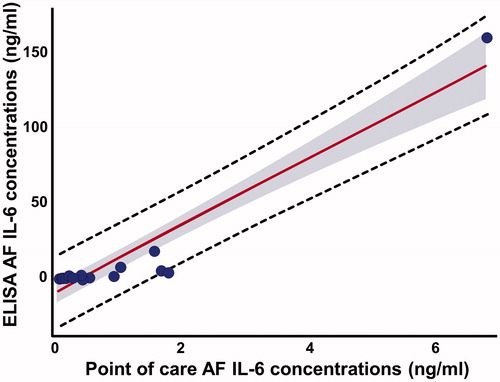
Figure 4. Bland–Altman plot: direct comparison between enzyme-linked immunosorbent assay (ELISA) and lateral flow-based immunoassay point of care (POC) amniotic fluid (AF) interferon-γ – inducible protein 10 (IP-10 or CXCL 10) techniques. SD, standard deviation.
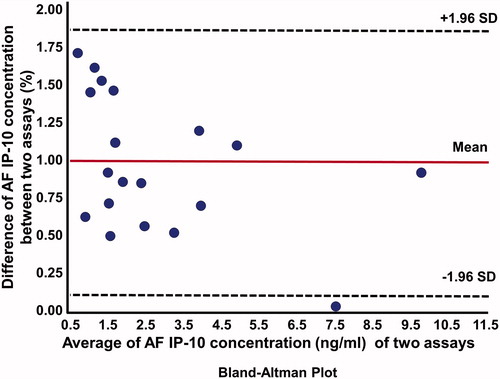
Figure 5. Amniotic fluid (AF) concentrations of interferon-γ – inducible protein 10 (IP-10 or CXCL-10) determined by enzyme-linked immunosorbent assay (ELISA) (square) and lateral flow-based immunoassay point of care (POC) test (circle) of patients with preterm labor.
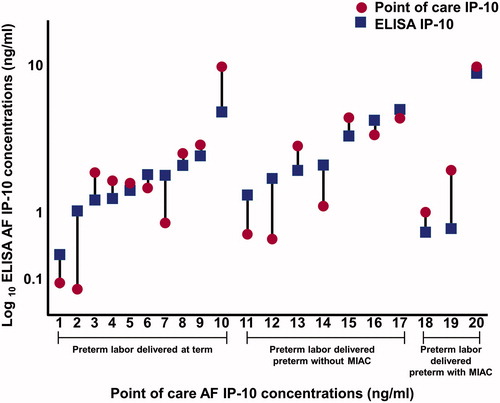
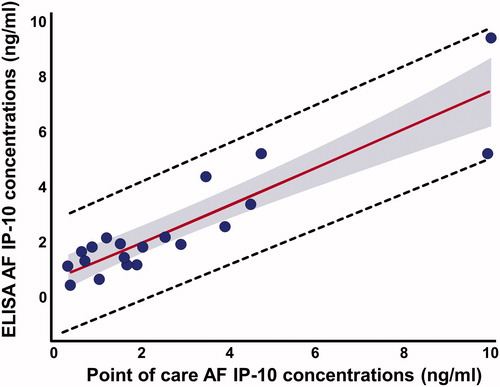
Figure 6. Amniotic fluid (AF) interferon-γ – inducible protein 10 (IP-10 or CXCL-10) scatter diagram with linear regression line (red line). Dashed line indicates 95% confidence interval.