
Figures & data
Table 1. Summary data showing participant characteristics as means and standard deviations (or counts and percentages) for the total sample, and classified as hearing aid adopters and non-adopters, along with statistical test results comparing adopters and non-adopters.
Figure 1. Overview of study procedure including retention of participants.
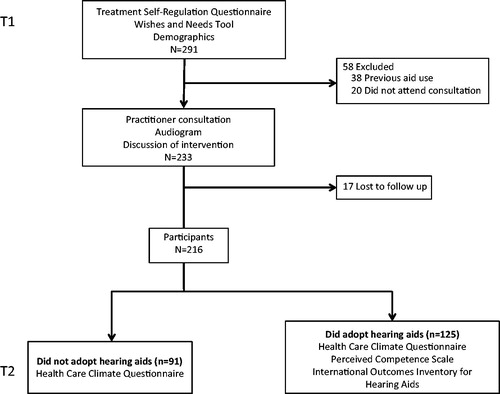
Table 2. Descriptive data of perceived competence scale (PCS) and international outcomes inventory for hearing aids (IOI-HA) scores for hearing aid adopters.
Table 3. Matrix for pairwise correlation coefficients (r) showing linear relationships among independent variables for hearing aid adopters (N = 125).
Table 4. Regression models of factors associated with each outcome of interest.