
Figures & data
Table 1. Baseline participant audiometric and demographic data.
Figure 1. Adapted University of Rhode Island change assessment scores with ±1 standard error bars by group. Dark bars are the scores of participants who did not take up hearing aids, light bars are scores of participants who took up hearing aids.
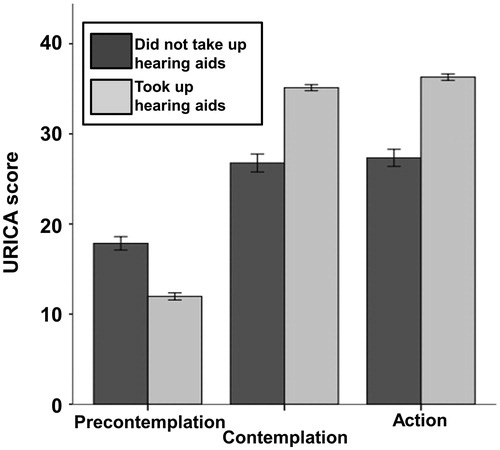
Table 2. Percentage and number of participants who did and did not take up hearing aids (HAs) as a function of their baseline URICA stage of change, along with the result of a Pearson chi-square analysis.
Figure 2. HBQ scores with ±1 standard error bars by group. Dark bars are the scores of participants who did not take up hearing aids, light bars are scores of participants who took up hearing aids.
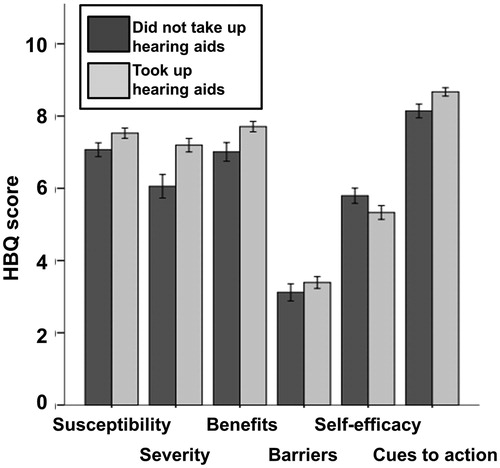
Figure 3. Histogram of the predicted probability of hearing-aid uptake (lower panel) and no hearing-aid uptake (upper panel) using age, four frequency better-ear average, reported duration of hearing difficulty and baseline scores on the hearing handicap inventory, University of Rhode Island change assessment, and hearing beliefs questionnaire as predictors.
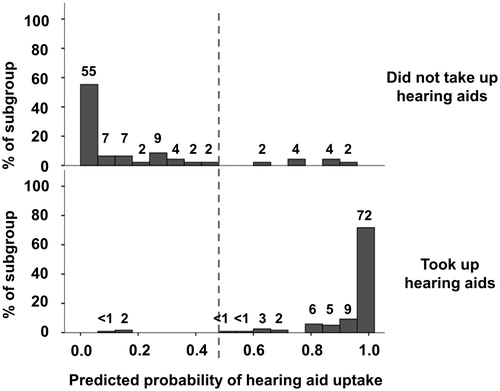
Table 3. Results of binary logistic regression modeling hearing-aid uptake from age, duration of hearing difficulty, 4F-BEA, HHI, URICA (precontemplation, contemplation, and action scales) and HBQ (susceptibility, severity, benefits, barriers, self-efficacy, and cues to action scales) scores. The significant predictors (p < 0.05) are in bold font.
Table 4. Pearson correlations between attitudes and beliefs (URICA and HBQ scores) at baseline and follow up, and hearing-aid outcomes (IOI-HA and PIADS). To adjust for multiple analyses only correlations with an associated p < 0.001 were considered to be statistically significant. Statistically significant correlations are indicated in bold font.
Table 5. Multiple linear regression analyses modeling hearing-aid outcomes as assessed with the IOI-HA and PIADS.
Table 6. HBQ scores at baseline and at six-month follow-up separated by whether or not an individual took up hearing aids. Baseline and follow-up scores that differ significantly are shown in bolded font.