1,287
Views
9
CrossRef citations to date
0
Altmetric
ARTICLES

Computational Opioid Prescribing: A Novel Application of Clinical Pharmacokinetics

&
Pages 125-135 | Published online: 09 Jun 2011

Figures & data

FIGURE 1  One-compartment models. The intravascular administration model (left panel) is characterized by a single sampled compartment into which a dose of drug is administered. The triangle cuts into the sampled compartment. In these models, DB represents the mass of drug in the body, Vd is the apparent volume of distribution of drug, and C represents the drug concentration, equal to D/Vd. ke represents the first-order elimination rate constant (h−1). Drug is eliminated in the urine unchanged and in metabolite form. In the extravascular administration model (right panel), a dose of drug is administered into a compartment from which the drug is transferred into the body via the gastrointestinal tract. F represents the drug's bioavailability. ka is the first-order absorption rate constant. The steady-state plasma concentration of opioid over time for oral dosing is independent of ka, so the path from DGI to DB equals Dose × F.

FIGURE 1  One-compartment models. The intravascular administration model (left panel) is characterized by a single sampled compartment into which a dose of drug is administered. The triangle cuts into the sampled compartment. In these models, DB represents the mass of drug in the body, Vd is the apparent volume of distribution of drug, and C represents the drug concentration, equal to D/Vd. ke represents the first-order elimination rate constant (h−1). Drug is eliminated in the urine unchanged and in metabolite form. In the extravascular administration model (right panel), a dose of drug is administered into a compartment from which the drug is transferred into the body via the gastrointestinal tract. F represents the drug's bioavailability. ka is the first-order absorption rate constant. The steady-state plasma concentration of opioid over time for oral dosing is independent of ka, so the path from DGI to DB equals Dose × F.

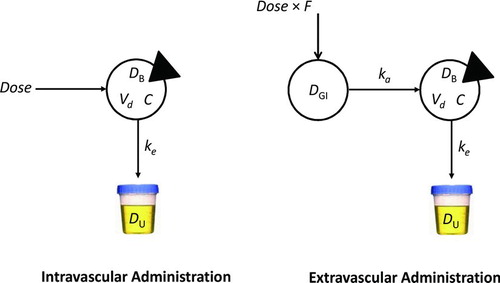
TABLE 1  Opioid Population Pharmacokinetic Parameter Estimates Using the Bootstrap