Figures & data
Figure 1. Proposed framework of an in vitro systems toxicological assessment of e-liquids. The framework assessment covers three layers of assessments, integrated into a systems toxicology-based approach. The framework is aimed at enabling a systems-level analysis of the cellular mechanistic toxicity of both e-liquids and their aerosols using relevant biological in vitro test systems. An analytical chemistry investigation is used complementarily to provide accurate and reliable chemistry data solidifying the toxicological assessment.
Figure 2. Commercially available aerosol generation devices. Aerosols from various e-liquids can be generated using many commercially available devices: A Condensation Monodisperse Aerosol Generator; B, Collison nebulizer; C, Vitrocell spiking system; D, Smoking machines, where e-cig devices can be “vaped”.
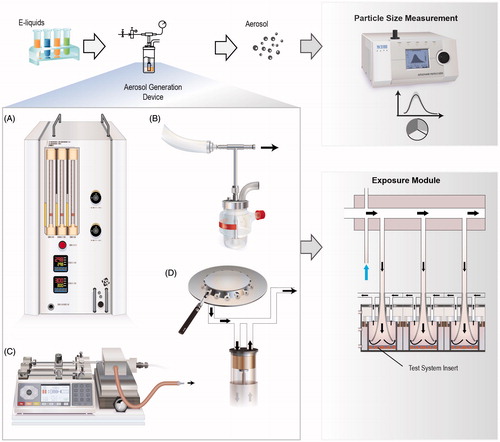
Table 1. Aerosol generation and particle measurement devices suitable for e-liquids assessment.
Figure 3. Three layers of the in vitro systems toxicology assessment framework of e-liquids. The framework is aimed at complementing the battery of classical assays for toxicity assessment of tobacco products. Extensions of the framework can be made to address specific scientific questions, such as an evaluation of the effects of heating power or puff topography for specific e-cig devices, or to specifically assess the effect of flavor compounds and identify the acceptable compounds by incorporating a “flavor toolbox” of assessment. Dosimetry can be further used to support the necessary context for estimating the human exposure dose.
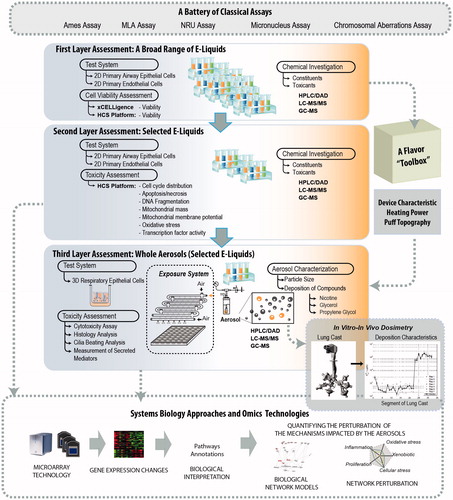
Figure 4. First-layer assessment of cell viability. A, Composition of the test mixtures. B, The endpoint measured within the first layer of assessment. C, Cell index and D, cell count to measure cell viability following incubation with PG.G and PG.G/Nic mixtures in NHBE cells. The area under the curve was plotted (for each technical replicates) following normalization to vehicle control and positive control as 0 and 100% cell index, respectively. Values of the cell index and cell count were plotted and fitted using a four-parameter Hill equation. [†] indicates the EC50 values. Values that are not automatically included in curve fitting computations by the software are shown in gray.
![Figure 4. First-layer assessment of cell viability. A, Composition of the test mixtures. B, The endpoint measured within the first layer of assessment. C, Cell index and D, cell count to measure cell viability following incubation with PG.G and PG.G/Nic mixtures in NHBE cells. The area under the curve was plotted (for each technical replicates) following normalization to vehicle control and positive control as 0 and 100% cell index, respectively. Values of the cell index and cell count were plotted and fitted using a four-parameter Hill equation. [†] indicates the EC50 values. Values that are not automatically included in curve fitting computations by the software are shown in gray.](/cms/asset/8d21eedc-fe67-4340-ad02-7b6b7a8a5ee2/itxm_a_1170251_f0004_c.jpg)
Figure 5. Leveraging the first-layer assessment to evaluate the impact of flavors on cell viability. A, Composition of the test mixtures. The impact of each flavor-mixture was assessed relative to its corresponding base solutions. B, The endpoint measured within the first layer of assessment. C and D, Cell index measurement to evaluate cell viability following a 24-h incubation with the flavor mixtures 1 and 2, respectively in NHBE cells. The area under the curve was plotted (for each technical replicates, N = 3) following normalization to vehicle control and positive control as 0 and 100% cell index, respectively. Values of the cell index and cell count were plotted and fitted using a four-parameter Hill equation. [†] indicates the EC50 values.
![Figure 5. Leveraging the first-layer assessment to evaluate the impact of flavors on cell viability. A, Composition of the test mixtures. The impact of each flavor-mixture was assessed relative to its corresponding base solutions. B, The endpoint measured within the first layer of assessment. C and D, Cell index measurement to evaluate cell viability following a 24-h incubation with the flavor mixtures 1 and 2, respectively in NHBE cells. The area under the curve was plotted (for each technical replicates, N = 3) following normalization to vehicle control and positive control as 0 and 100% cell index, respectively. Values of the cell index and cell count were plotted and fitted using a four-parameter Hill equation. [†] indicates the EC50 values.](/cms/asset/36794896-a5e4-45b2-bda2-786ba162ec8e/itxm_a_1170251_f0005_c.jpg)
Figure 6. Endpoints measured within the second-layer assessment of cell viability. Abbreviations: GSH: glutathione; ROS: reactive oxygen species.
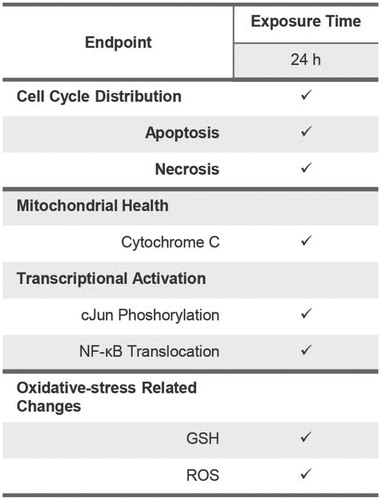
Figure 7. HCS-based analysis of cell cycle distribution. A, Relative proportion of cells for each phase of the cell cycle was then plotted. B, Apoptotic cells were measured based on the active caspase 3/7 positive-stained cells and C, necrotic cells were measured based on TO-PRO-caspase 3-positive stained cells using the HCS platform.
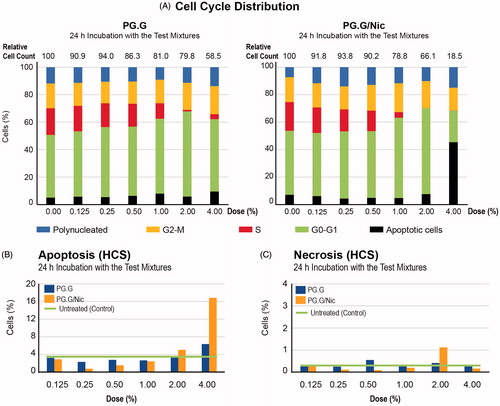
Figure 8. Toxicity-related mechanisms assessment of liquid mixtures in NHBE cells. A, Mitochondrial health; B, transcription factor activation, C, oxidative stress-related changes were measured in NHBE cells incubated for 24 h with PG.G or PG.G/Nic mixtures using HCS assays. The area under the curve was plotted after normalization against the vehicle control (no detected signal). Values that are not automatically included in curve fitting computations by the software are shown in gray. Abbreviations: GSH: glutathione NF-κB: nuclear factor kappa B; ROS: reactive oxygen species.
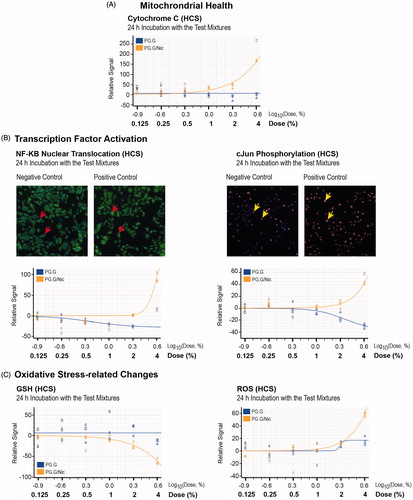
Figure 9. Experimental design to test the nebulized aerosols generated from the various test mixtures. A, An illustration of the generation of aerosols from the various test items using the Collison nebulizer and of the exposure set-up using the Vitrocell exposure system. The 3D bronchial epithelial cultures (reconstituted from one donor) were exposed to three different aerosols generated by nebulizing PG.G, PG.G/Nic, or sbPBS mixtures. B, The experimental groups. C, Various endpoints measured within the third-layer assessment. Abbreviations: AK: adenylate kinase; Nic: nicotine; PBS: phosphate-buffered saline; PG.G: propylene glycol and glycerol; PG.G/Nic: propylene glycol, glycerol, and nicotine; sbPBS: smoke-bubbled PBS.
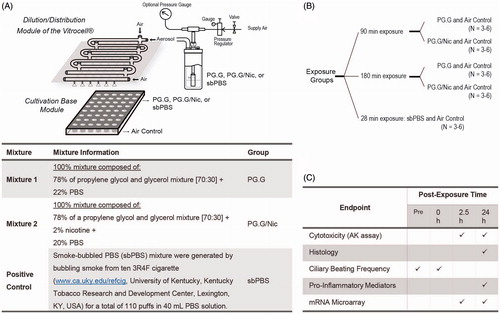
Figure 10. Cytotoxicity assessment of the whole aerosols in a 3D bronchial culture model. A, Representative images of the H&E-stained bronchial culture sections. Duration of the exposure was specified on the top of the images. B, Normalized cytotoxicity levels were evaluated by measuring adenylate kinase (AK) activity in the basolateral media after 90- and 180-min exposures. The AK levels (y-axis) were calculated (N = 5–6) relative to the Triton-X-treated cultures (100% as the positive control, N = 6).
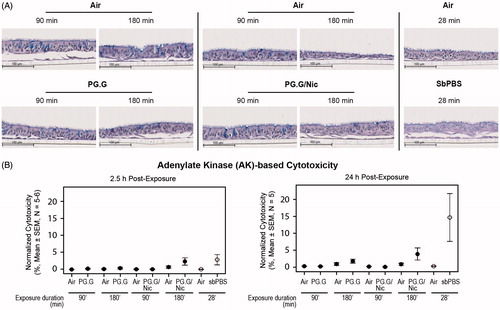
Figure 11. Cilia beating alterations following whole aerosol exposures in a 3D bronchial culture model. A, An illustration of mucociliary clearance and ciliary beating movement. B, Levels of ciliary beating frequency, and C, Ciliary beating power (normalized to the baseline pre-exposure) measured after a 90-min exposure and 180-min exposure to the test aerosols. The 3D bronchial cultures were reconstituted from a single donor as described in the materials and methods.
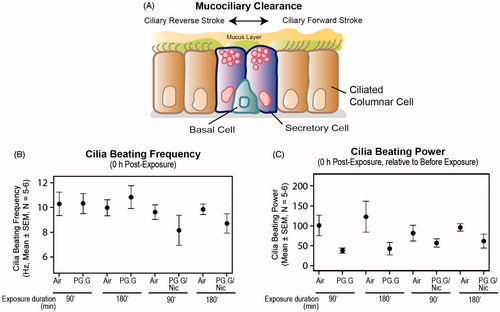
Figure 12. Profiles of secreted mediators following exposure. Concentrations of various mediators were measured in the basolateral media of the cultures at 24-h post-exposure using a Luminex-based technology. Abbreviations: CSF: colony-stimulating factor; CXCL1: chemokine (C-X-C motif) ligand 1; G-CSF: granulocyte colony-stimulating factor; IL: interleukin; MMP: matrix metalloproteinase TIMP1: tissue inhibitor of metalloproteinase 1.
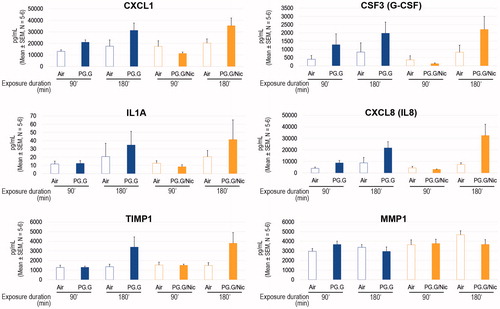
Figure 13. Systems toxicological assessment using biological network models. A, An illustration of the derivation of network perturbation amplitude (NPA) using causal network models and transcriptome data to assess the impact of exposure relative to controls. The NPA methodology has been described previously (Martin et al., Citation2014). B, Exposure-induced perturbation of osmotic stress network model. Each node contains the information pertaining to the levels of perturbation associated with the test aerosols. Insets, perturbations of hyperosmotic response (coded in BEL language as “bp(GOBP:hyperosmotic response), the kinase activity of ataxia-telangiectasia mutated (ATM) (coded as kin(p(HGNC:ATM)), and the nuclear factor (NF)-κB complex (coded as “complex(SCOMP:Nfkb Complex)”) are shown.
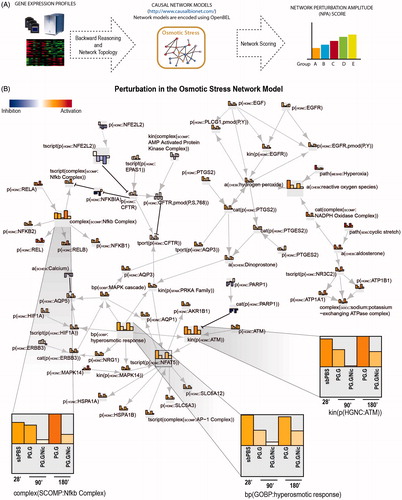
Figure 14. Particle size distribution of the aerosols and depositions in the Vitrocell base module. A, The droplet size distribution of the aerosol generated using the Collison nebulizer (N = 3). Error bars indicate the standard error of the mean. B, Concentrations of PG, G, and Nic in the PBS-filled inserts placed in the Vitrocell base module after exposure to the test aerosols for 30, 60, 90, or 180 min (upper panels). The proportion of PG, G, and Nic in the PBS-filled inserts after they were exposed to the test aerosols for the various exposure durations (lower panel). Abbreviations: G: glycerol; Nic: nicotine; PG: propylene glycol.
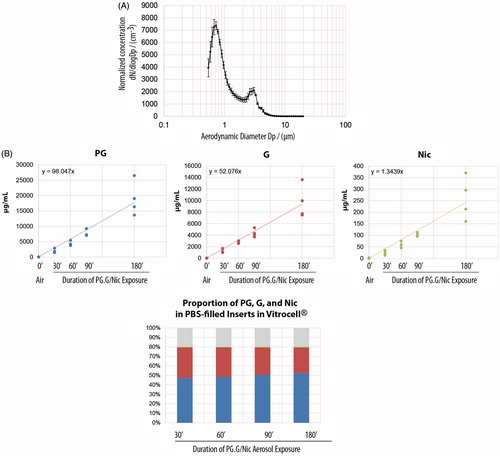
Figure 15. Experimental design to test ENDS aerosol as compared to 3R4F smoke. A, An illustration of the generation of aerosol using a smoking machine and of the exposure set-up using the Vitrocell exposure system. The CORESTA recommendation of E-cig smoking protocol was used to generate ENDS aerosol; whereas Health Canada smoking protocol was used to generate 3R4F smoke. B, the experimental groups. The 3D bronchial epithelial cultures were exposed to aerosols from a representative e-cig and smoke from 3R4F at the comparable nicotine concentration in the aerosol/smoke. C, Various endpoints measured following exposure. Abbreviations: AK: adenylate kinase; ENDS: electronic nicotine delivery systems.
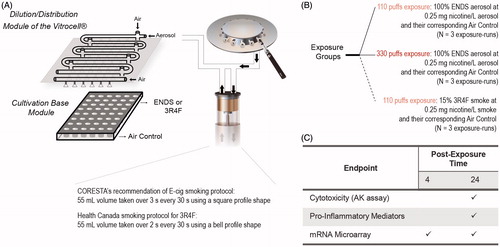
Figure 16. Cytotoxicity and secretion of mediators following 100% ENDS aerosol exposure as compared with 3R4F smoke in a 3D bronchial culture model. A, normalized cytotoxicity levels were evaluated by measuring adenylate kinase (AK) activity in the basolateral media after the cultures were exposed to e-cig aerosol and 3R4F smoke. Triton-X treated cultures were considered as 100% cytotoxicity. B, Fold changes of various mediators were measured in the basolateral media of the cultures at 24 h post-exposure using a Luminex-based technology. Abbreviations: CCL: chemokine C-C Motif Ligand; CSF: colony-stimulating factor; G-CSF: granulocyte colony-stimulating factor; GM-CSF: granulocyte–macrophage colony-stimulating factor; IL: interleukin; IP-10; interferon gamma-induced protein 10; MCP: monocyte chemoattractant protein; MIP3a: macrophage inflammatory protein; MMP: matrix metalloproteinase; Rantes: regulated on activation, normal T-cell expressed and secreted; sICAM1: soluble intercellular adhesion molecule-1; TIMP1: tissue inhibitor of metalloproteinase; TNFA: tumor necrosis factor alpha; TSLP: thymic stromal lymphopoietin; VEGFA: vascular endothelial growth factor.
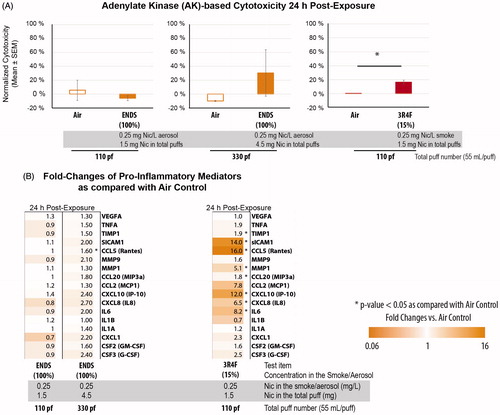
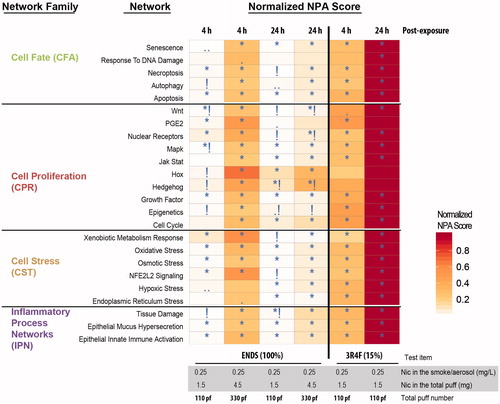
Figure 17. Systems toxicological assessment of 100% ENDS aerosol and 15% 3R4F smoke using biological network models. Heatmap showing network models that were significantly impacted in at least one contrast (exposed versus air-control). A network is significantly perturbed (*) if the NPA score remains significant after accounting for the experimental variation and if the companion statistics O and K are significant, details of the NPA algorithm was described previously (Martin et al., Citation2014). The symbol (•) indicates p values of O and K between 0.05 and 0.75; (••) indicates p values of O and K between 0.075 and 0.100; and (!) indicates non significance with respect to the experimental variation.