663
Views
13
CrossRef citations to date
0
Altmetric
ORIGINAL RESEARCH

Identification of Occult Parechymal Disease Such as Emphysema or Airway Disease Using Screening Computed Tomography

, , , , , & show all
Pages 117-125 | Published online: 16 Apr 2010

Figures & data

Table 1. Subject characteristics

Table 2. Chest computed tomography findings

Figure 1. The relationship between the LAA% (A), visual score (B) and FEV1/FVC in COPD patients. The relationship between the LAA%, the visual score and FEV1/FVC showed significance in COPD patients (p = 0.005, 0.044 and r = 0.29, 0.24, respectively).
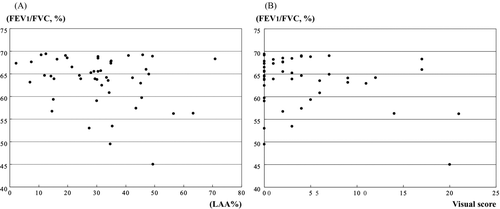
Figure 1.  The relationship between the LAA% (A), visual score (B) and FEV1/FVC in COPD patients. The relationship between the LAA%, the visual score and FEV1/FVC showed significance in COPD patients (p = 0.005, 0.044 and r = 0.29, 0.24, respectively).

Figure 2. Histograms showing the distribution of both LAA% and visual score in non-smoker, smoker and COPD patient. There was no significant difference in the LAA% between non-smoker and smoker. The visual score showed significant difference in non-smoker in comparison to smokers and COPD patient.
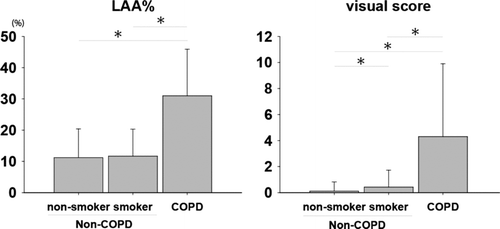
Figure 2.  Histograms showing the distribution of both LAA% and visual score in non-smoker, smoker and COPD patient. There was no significant difference in the LAA% between non-smoker and smoker. The visual score showed significant difference in non-smoker in comparison to smokers and COPD patient.

Table 3. Characteristics of individuals with LAA%, including those diagnosed having COPD

Table 4. Threshold for COPD using the combination of LAA% and visual score

Figure 3. Receiver operating characteristic (ROC) curves for COPD using the low attenuation area (LAA%; A) and visual score (B). The area under the ROC curve for the LAA% is 0.87, and that for visual score is 0.80. The sensitivity and specificity of these individual variables for the screening of COPD were: threshold of the LAA% (range, 0–100%); 10% (sensitivity 93.8%, specificity 52.9%), 20% (sensitivity 72.9%, specificity 83.1%), and 30% (sensitivity 58.3%, specificity 95.7%) and threshold of visual score (range 0–24); 1 (sensitivity 66.7%, specificity 90.1%), 2 (sensitivity 58.3%, specificity 92.2%), and 3 (sensitivity 47.9%, specificity 95.8%).
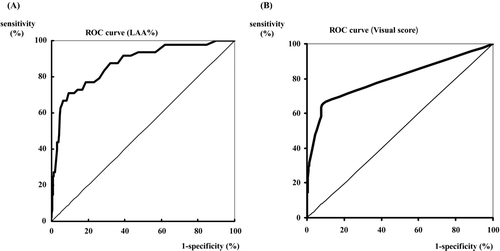
Figure 3.  Receiver operating characteristic (ROC) curves for COPD using the low attenuation area (LAA%; A) and visual score (B). The area under the ROC curve for the LAA% is 0.87, and that for visual score is 0.80. The sensitivity and specificity of these individual variables for the screening of COPD were: threshold of the LAA% (range, 0–100%); 10% (sensitivity 93.8%, specificity 52.9%), 20% (sensitivity 72.9%, specificity 83.1%), and 30% (sensitivity 58.3%, specificity 95.7%) and threshold of visual score (range 0–24); 1 (sensitivity 66.7%, specificity 90.1%), 2 (sensitivity 58.3%, specificity 92.2%), and 3 (sensitivity 47.9%, specificity 95.8%).

Reprints and Corporate Permissions

Please note: Selecting permissions does not provide access to the full text of the article, please see our help page How do I view content?

To request a reprint or corporate permissions for this article, please click on the relevant link below:

Academic Permissions

Please note: Selecting permissions does not provide access to the full text of the article, please see our help page How do I view content?

Obtain permissions instantly via Rightslink by clicking on the button below:

If you are unable to obtain permissions via Rightslink, please complete and submit this Permissions form. For more information, please visit our Permissions help page.