671
Views
9
CrossRef citations to date
0
Altmetric
ORIGINAL RESEARCH

Factors Discriminating Spontaneous Pursed-Lips Breathing Use in Patients with COPD

, , &
Pages 254-261 | Published online: 30 Jul 2010

Figures & data

Figure 1. Example of a nasal pressure (Pno) recording obtained in a representative subject. Expiration performed through either the nose or the mouth produces a positive deflection of Pno (left half), whereas PLB causes Pno to drop to 0 cm H2O during the expiratory phase of breathing (right half).
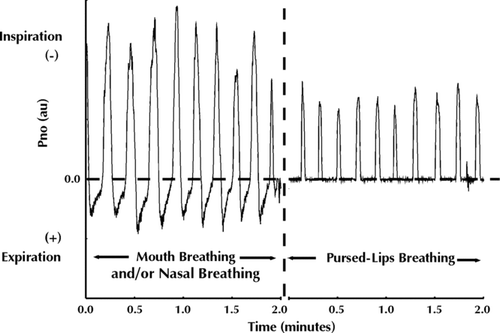
Figure 1.  Example of a nasal pressure (Pno) recording obtained in a representative subject. Expiration performed through either the nose or the mouth produces a positive deflection of Pno (left half), whereas PLB causes Pno to drop to 0 cm H2O during the expiratory phase of breathing (right half).

Table 1. Characteristics of the 51 patients with COPD stratified according to the four PLB groups

Figure 2. The average values (±SD) for the (a) FEV1 (% predicted), (b) FEV1/FVC (%), and (c) FEF 25–75 (% predicted) in the four PLB groups. P values indicate significance in post hoc pairwise comparisons.
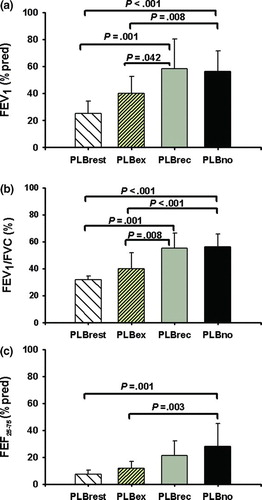
Figure 2.  The average values (±SD) for the (a) FEV1 (% predicted), (b) FEV1/FVC (%), and (c) FEF 25–75 (% predicted) in the four PLB groups. P values indicate significance in post hoc pairwise comparisons.

Figure 3. The relationship of (a) dyspnea measured using a modified Borg scale and VE and (b) dyspnea to W% predicted max. Lines represent the average slopes for the four PLB groups. Shaded areas represent ±SE for the slopes. Error bars are ±SE for dyspnea. Solid lines and cross hatched areas, PLBrest; long dashed lines and dark grey areas, PLBex; short dashed lines and light grey areas, PLBrec; dotted lines and diagonally lined areas, PLBno.
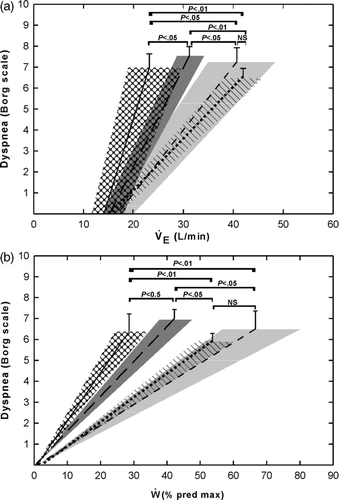
Figure 3.  The relationship of (a) dyspnea measured using a modified Borg scale and VE and (b) dyspnea to W% predicted max. Lines represent the average slopes for the four PLB groups. Shaded areas represent ±SE for the slopes. Error bars are ±SE for dyspnea. Solid lines and cross hatched areas, PLBrest; long dashed lines and dark grey areas, PLBex; short dashed lines and light grey areas, PLBrec; dotted lines and diagonally lined areas, PLBno.

Table 2. Physiological parameters at end exercise in 51 patients with COPD stratified according to the four PLB groups

Table 3. Univariate logistic regression models for the performance of PLB during exercise

Table 4. Multivariate logistic regression model for the performance of PLB during exercise

Reprints and Corporate Permissions

Please note: Selecting permissions does not provide access to the full text of the article, please see our help page How do I view content?

To request a reprint or corporate permissions for this article, please click on the relevant link below:

Academic Permissions

Please note: Selecting permissions does not provide access to the full text of the article, please see our help page How do I view content?

Obtain permissions instantly via Rightslink by clicking on the button below:

If you are unable to obtain permissions via Rightslink, please complete and submit this Permissions form. For more information, please visit our Permissions help page.