Figures & data
Figure 1. Aortic calcification measurement. Shown is a representative screen image of the Aquarius Workstation highlighting areas of calcification within the thorax (>130 Hounsfield Units). The red arrow highlights an area of thoracic aortic calcification. The total aortic calcification score, or Agatston calcium score, was determined by obtaining the sum of each CT slice's area of calcification multiplied by a coefficient based on the peak CT number. Calcifications in the aortic valve and coronary arteries were excluded from analysis.
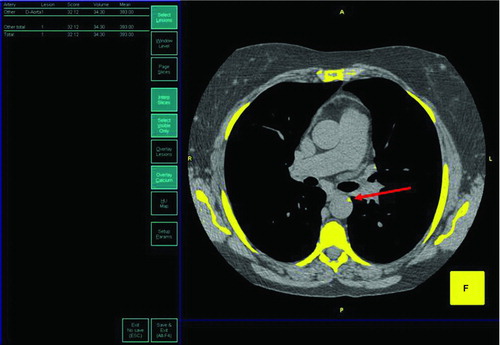
Table 1. Subject characteristics
Table 2. Univariate analyses between subject characteristics and calcium score
Table 3. Final multivariate model for predictors of calcium score