Figures & data
Table 1. Characteristics of all patients
Table 2. Table of sputum characteristics, cell counts, MPO activity and 3Cl-Tyr levels for individual patients
Figure 1. Showing a portion of a 3Cl-Tyr standard curve to emphasis its linear nature and LOQ. Standard curves were constructed upto 1000 ng/ml with linearity being maintained to this point
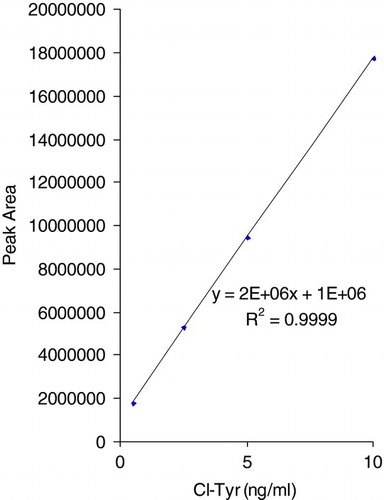
Figure 2. A) shows a chromatograph obtained from a 0.5 ng/ml 3Cl-Tyr in PBS standard. B) shows an example chromatograph obtained from a COPD sputum sample.
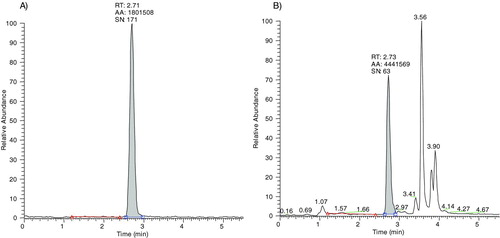
Figure 3. Correlation between MPO activity and neutrophil numbers in sputum. Each point represents one patient sample. r = 0.636, p = 0.02.
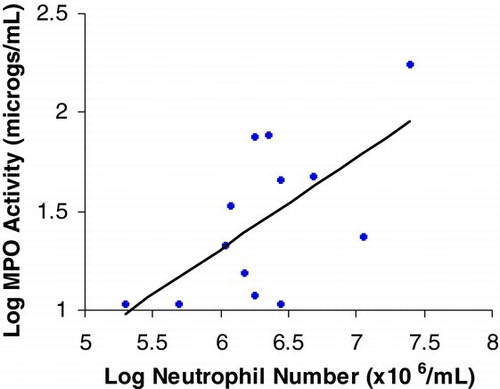
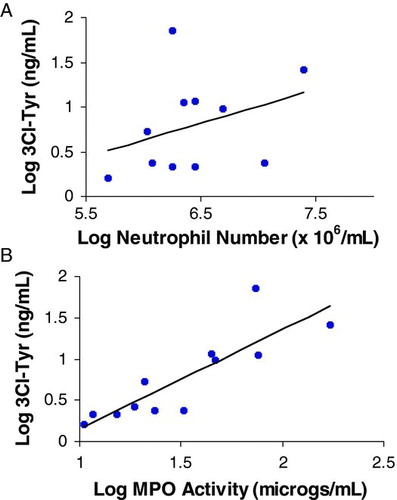
Figure 4. Correlation of 3Cl-Tyr with neutrophil number A and MPO activity B in sputum. Each point represents one patient sample. r = 0.37 (P < 0.05) for A and 0.88 (P < 0.0001) for B.