Figures & data
Table 1 Patient characteristics, LFTs and quantitative CT parameters at inclusion
Table 2 Change in CT lung density and lung function in association with smoking cessation in the whole study population (n = 36)
Figure 1 Effect of smoking cessation on lung density in patients with COPD. Lung density is objectively quantitated from CT scans as PD15 (15th percentile density) in Hounsfield units (HU) and RA-910 (relative area of emphysema below -910 HU), both changed significantly with smoking cessation with a p-value of 0.0002 and 0.003, respectively. Error bars represent the standard error of the mean.
Figure 2 Change in CT lung density following smoking cessation in patients with COPD during treatment with ICS (budesonide) or placebo. Error bars represent the standard error of the mean.
Figure 3 Effect of smoking cessation on lung function in patients with COPD. Forced expiratory volume in one second (FEV1) and diffusion capacity (DLCO) did not change significantly with smoking cessation with a p-value of 0.14 and 0.48, respectively. Error bars represent the standard error of the mean.
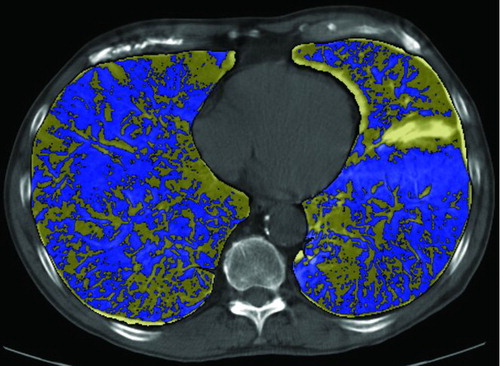
Figure 4 Computer-aided comparison of the extent of emphysema before and after smoking cessation. The lung contours are first defined and subsequently aligned. Digital subtraction of the images with colour coding shows the abundance of areas with fall in lung density (blue) in comparison to areas with increase in lung density (yellow) (Citation31).