792
Views
19
CrossRef citations to date
0
Altmetric
ORIGINAL RESEARCH

Kurtosis and Skewness of Density Histograms on Inspiratory and Expiratory CT Scans in Smokers

, , , , , , , , & show all
Pages 13-20 | Published online: 08 Feb 2011

Figures & data

Table 1  Clinical characteristics of 46 subjects

Figure 1  A 60-year-old male smoker with normal lung function (FEV1%predicted = 86%). Inspiratory (A) and expiratory (B) CT images and the density histograms are demonstrated. On the expiratory CT image (B), lung density increased particularly in dorsal parts of the bilateral lungs, resulting in heterogeneous lung density. Although inspiratory kurtosis and skewness are measured as 8.6 and 2.1, expiratory kurtosis and skewness decrease to 2.6 and 0.3. Note that the density histograms are obtained from all axial CT images that include the lung parenchyma, and not by a single image.
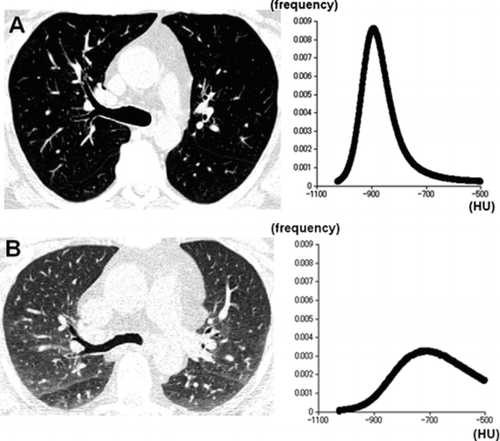
Figure 1  A 60-year-old male smoker with normal lung function (FEV1%predicted = 86%). Inspiratory (A) and expiratory (B) CT images and the density histograms are demonstrated. On the expiratory CT image (B), lung density increased particularly in dorsal parts of the bilateral lungs, resulting in heterogeneous lung density. Although inspiratory kurtosis and skewness are measured as 8.6 and 2.1, expiratory kurtosis and skewness decrease to 2.6 and 0.3. Note that the density histograms are obtained from all axial CT images that include the lung parenchyma, and not by a single image.

Figure 2  A 62-year-old man with chronic obstructive pulmonary disease (GOLD stage 4, FEV1%predicted = 21%). CT images and the density histograms at full inspiration (A) and expiration (B) are demonstrated. The changes in kurtosis and skewness are relatively small, suggesting more homogeneous lung density on the expiratory image (inspiratory scan, kurtosis = 10.6, skewness = 2.4; expiratory scan, kurtosis = 7.5, skewness = 1.9, respectively).
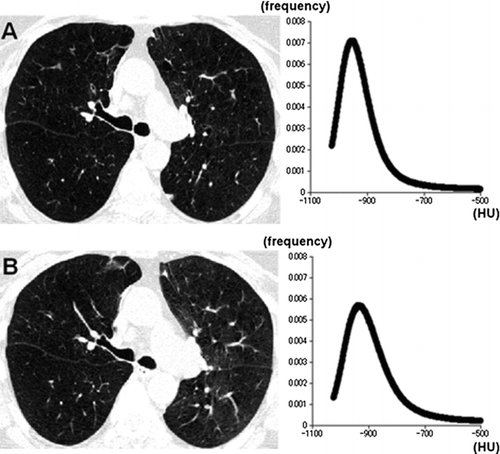
Figure 2  A 62-year-old man with chronic obstructive pulmonary disease (GOLD stage 4, FEV1%predicted = 21%). CT images and the density histograms at full inspiration (A) and expiration (B) are demonstrated. The changes in kurtosis and skewness are relatively small, suggesting more homogeneous lung density on the expiratory image (inspiratory scan, kurtosis = 10.6, skewness = 2.4; expiratory scan, kurtosis = 7.5, skewness = 1.9, respectively).

Table 2  CT measurements and correlations with lung function

Figure 3  Correlations between expiratory kurtosis and lung function. Significant correlations (p < 0.001) are observed between expiratory kurtosis and pulmonary function tests (FEV1%predicted, R = −0.581; FEV1/FVC, R = −0.612; RV/TLC, R = 0.613, respectively).
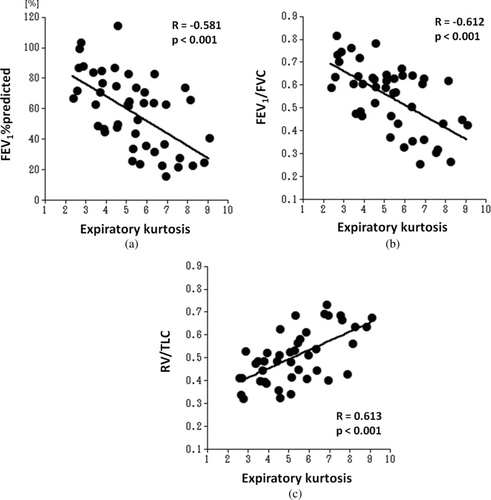
Figure 3  Correlations between expiratory kurtosis and lung function. Significant correlations (p < 0.001) are observed between expiratory kurtosis and pulmonary function tests (FEV1%predicted, R = −0.581; FEV1/FVC, R = −0.612; RV/TLC, R = 0.613, respectively).

Figure 4  Correlations between expiratory skewness and lung function. Similar to expiratory kurtosis, expiratory skewness shows significant correlations (p < 0.001) with pulmonary functions tests (FEV1%predicted, R = −0.584; FEV1/FVC, R = −0.619; RV/TLC, R = 0.585, respectively).
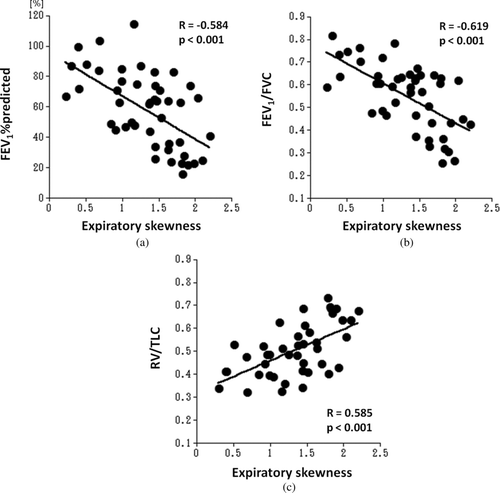
Figure 4  Correlations between expiratory skewness and lung function. Similar to expiratory kurtosis, expiratory skewness shows significant correlations (p < 0.001) with pulmonary functions tests (FEV1%predicted, R = −0.584; FEV1/FVC, R = −0.619; RV/TLC, R = 0.585, respectively).

Figure 5  Expiratory kurtosis or skewness in the subject groups according to the Global Initiative for Chronic Obstructive Lung Disease (GOLD) staging. Significant differences in expiratory kurtosis (A) and skewness (B) are observed in all pairs of subject groups. P values are obtained using the Bonferroni test.
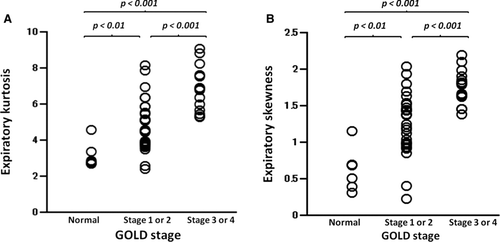
Figure 5  Expiratory kurtosis or skewness in the subject groups according to the Global Initiative for Chronic Obstructive Lung Disease (GOLD) staging. Significant differences in expiratory kurtosis (A) and skewness (B) are observed in all pairs of subject groups. P values are obtained using the Bonferroni test.

Reprints and Corporate Permissions

Please note: Selecting permissions does not provide access to the full text of the article, please see our help page How do I view content?

To request a reprint or corporate permissions for this article, please click on the relevant link below:

Academic Permissions

Please note: Selecting permissions does not provide access to the full text of the article, please see our help page How do I view content?

Obtain permissions instantly via Rightslink by clicking on the button below:

If you are unable to obtain permissions via Rightslink, please complete and submit this Permissions form. For more information, please visit our Permissions help page.