Figures & data
Table 1. Subjects’ demographics.
Table 2. Lung function parameters
Figure 1. FEV1% of predicted and FEV1/FVC ratio in CS-mild and CS-heavy. P< 0.05 compared to CS-mild.
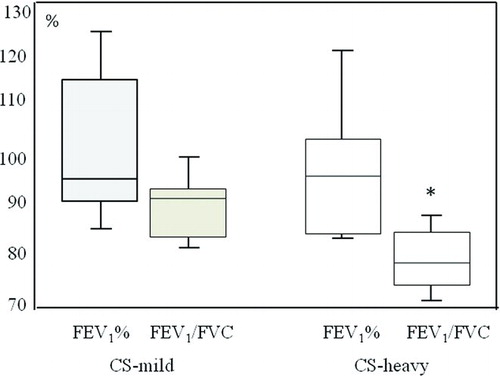
Figure 2. Airway resistance (Raw) and airway specific conductance (sGaw) values in CS-mild and CS-heavy. The median and ranges (boxes) are shown. P< 0.05 compared to CS-mild. Unit (U), the quality of y-axis is representing Raw (kPa·l−1·s) and sGaw (s−1·kPa−1).
Figure 3. Spearman's correlation between smoking history (pack-years) and airway specific conductance (sGaw). A significant negative correlation between smoking history (pack-years) and decline of airway conductance (p = 0.004, r = – 0.39).
Table 3. Relationships between lung function values, smoking history and age in smokers
Table 4. Characteristics of emphysematous lesions in chronic smokers