Figures & data
Table 1 Study population, basic characteristics by lung function (lf), gender, age, BMI and smoking habits
Table 2 Respiratory symptoms and co-morbidity in normal compared to restrictive lung function, in non-COPD compared to COPD, and by disease severity divided into GOLD stage I and ≥stage II, and in COPD compared to normal and also restrictive lung function
Figure 1 Symptoms and diseases in subjects with normal lung function (Nlf) and in subjects with COPD, by disease severity (divided into stage I and stage ≥II), in percent.
Figure 2 (a). Prevalence of and overlap between heart disease, chronic rhinitis and gastroesophageal reflux (GERD) in subjects with COPD (presented as percentage of all subjects with COPD, n = 993). (b). Prevalence of and overlap between heart disease, chronic rhinitis and gastroesophageal reflux (GERD) in subjects with normal lung function (presented as percentage of all subjects with normal lungfunction, n = 776).
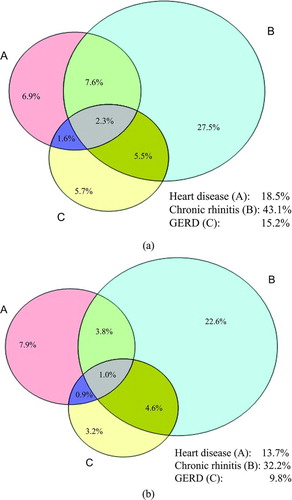
Table 3 Comparing respiratory symptoms and co-morbidity by gender in non-COPD and in COPD, respectively
Table 4 COPD stage I, COPD stage ≥II and restricted lung function analysed as risk factors for heart disease, hypertension, intermittent claudication (claudication), stroke, cardiovascular disease (CVD), diabetes, GERD and chronic rhinitis in a multivariate model adjusting for the co-variates gender, BMI, smoking habits and age presented as odds ratio, OR (95% confidence interval, CI)